🌍 Public
VAST Challenge 2019
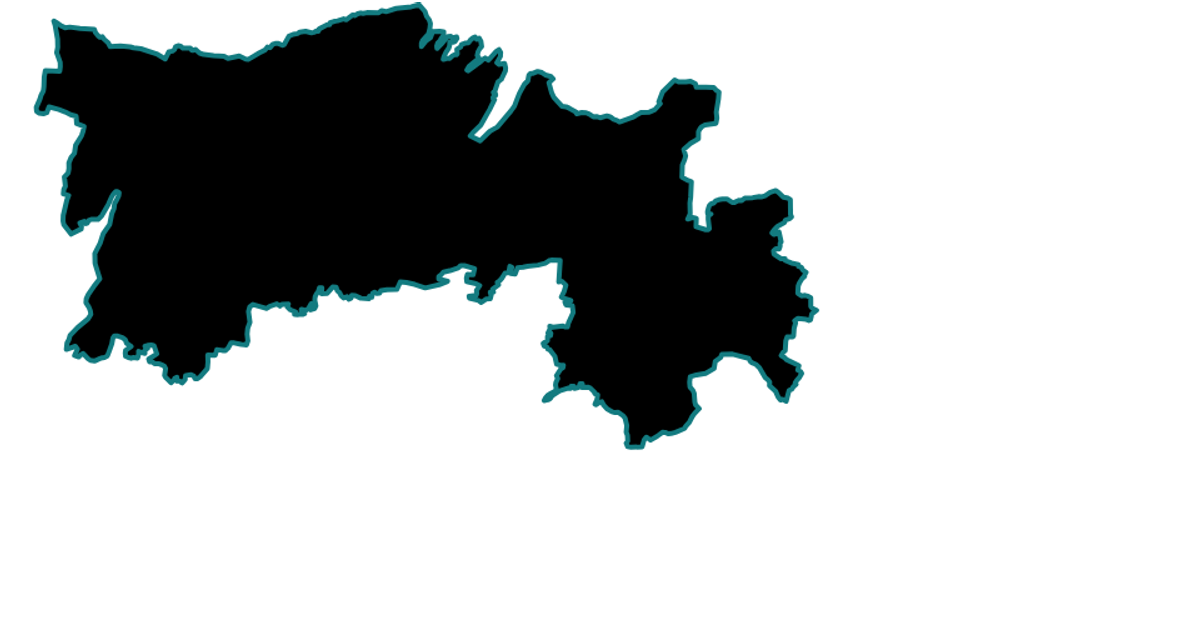
This example maps sensor locations from the VAST Challenge 2019 dataset onto a static SVG map of St. Himark. It renders geographic regions as filled paths and places circles at sensor coordinates using D3’s `geoNaturalEarth1` projection and `geoPath`. Built with React and D3.v7, the visualization uses `useSensors` to load CSV data asynchronously, while the SVG output supports hover transitions for highlighting hospitals.
AI-generated descriptionV1 VAST Challenge 2019 starting with a [map of St. Himark] (https://gist.github.com/Kathi7-dot/5aa9a67baaf444f1f516ab8a061ed095)
MIT Licensed




Comments
Sign in to join the discussion.