🌍 Public
[SR] Scatter Plot with React & D3
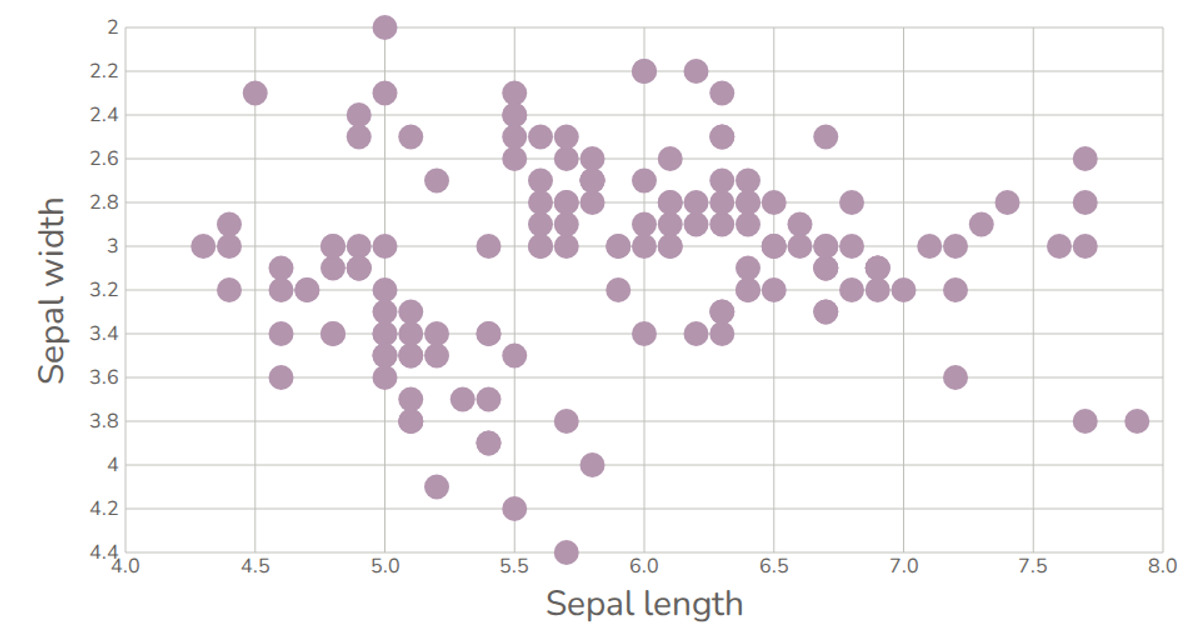
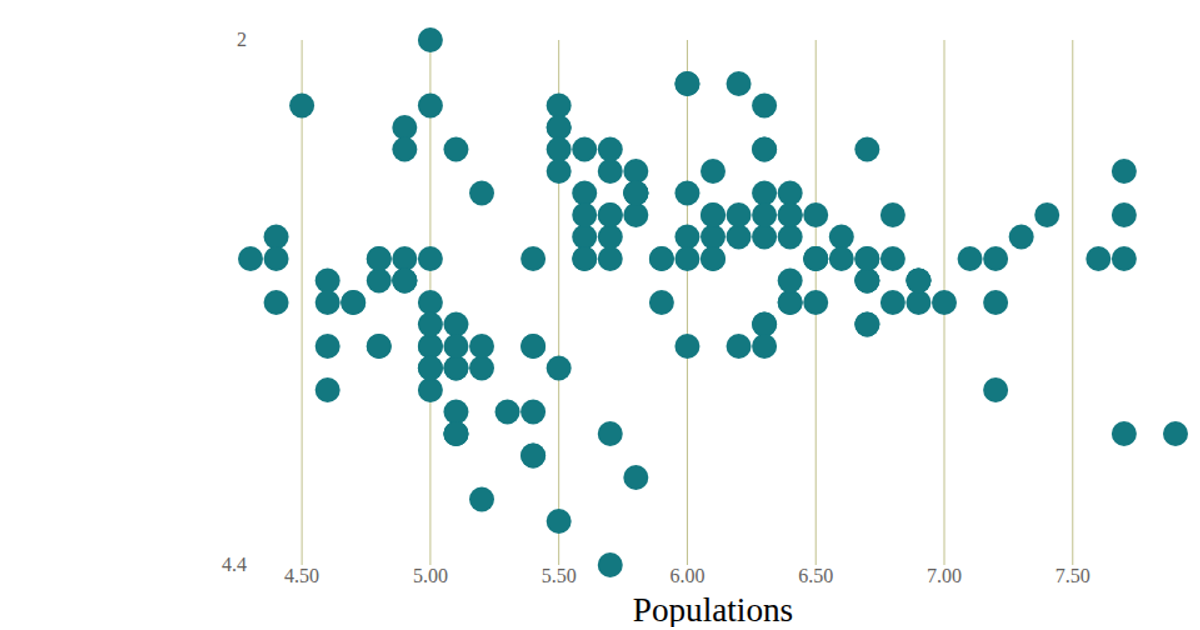
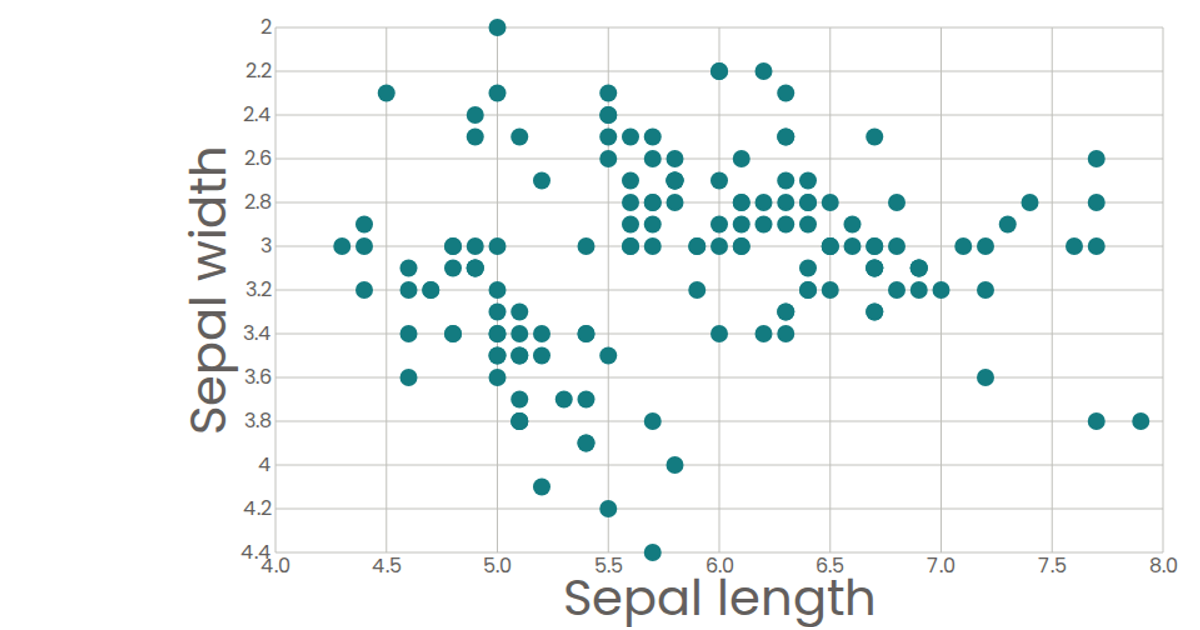
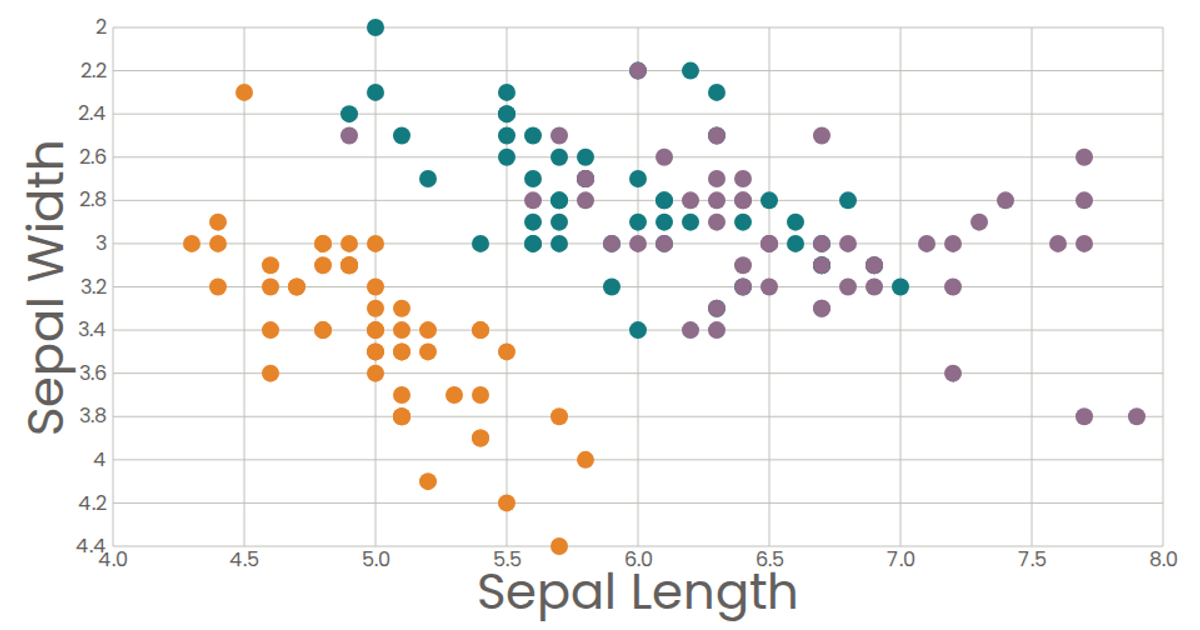
This scatter plot visualizes the relationship between sepal length and sepal width in the Iris dataset, with each point colored teal and showing tooltips on hover. The visualization is built using React components that leverage D3’s `scaleLinear` and `extent` for scaling axes, while custom `AxisBottom` and `AxisLeft` components render SVG tick marks and labels. Data is loaded asynchronously via D3’s `csv` parser from a GitHub gist. The chart displays formatted tick values (like compact notation) and includes rotated axis labels, with margins defining the plot area.
AI-generated descriptionSmiley face implementation with React.
MIT Licensed




Comments
Sign in to join the discussion.