🌍 Public
ICE-5 Sushmitha B
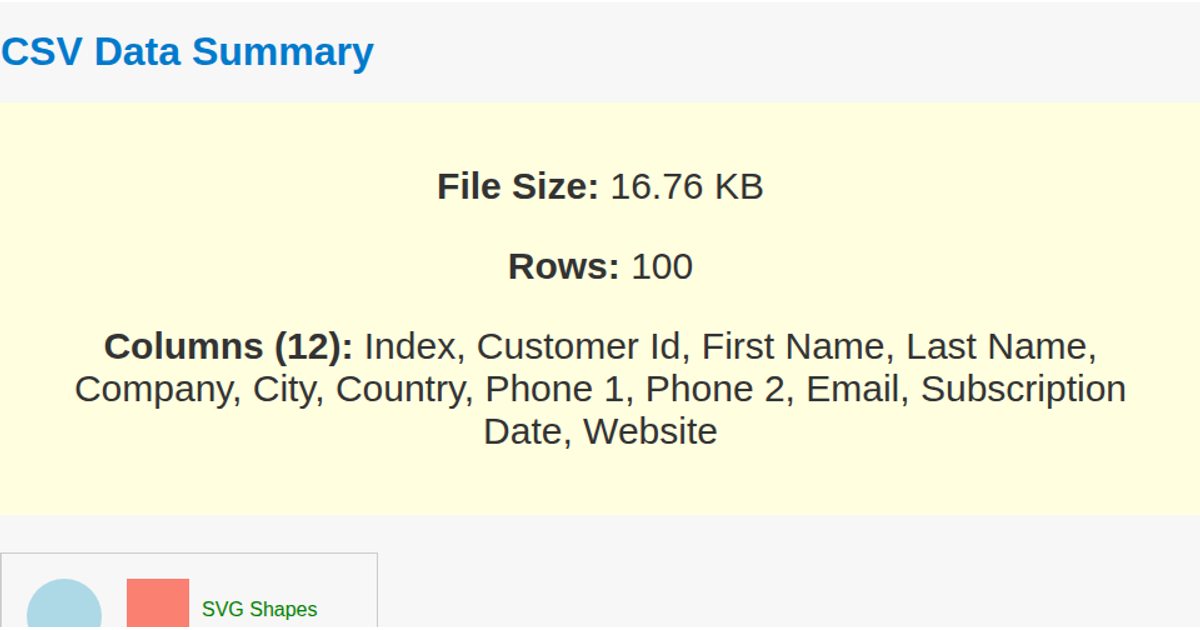
This example presents a static overview of Formula 1 race data. It displays a header with summary statistics, a table of the first five records from a remote CSV file, and a legend of F1 team cars as colored SVG circles. Using D3 v7, the visualization fetches and parses the data with `d3.csvParse`, then populates the table dynamically. The fixed SVG symbol legend defines team colors and names, while the dark theme and styling are handled by external CSS.
AI-generated descriptionMIT Licensed




Comments
Sign in to join the discussion.