Pseudo-Visualization
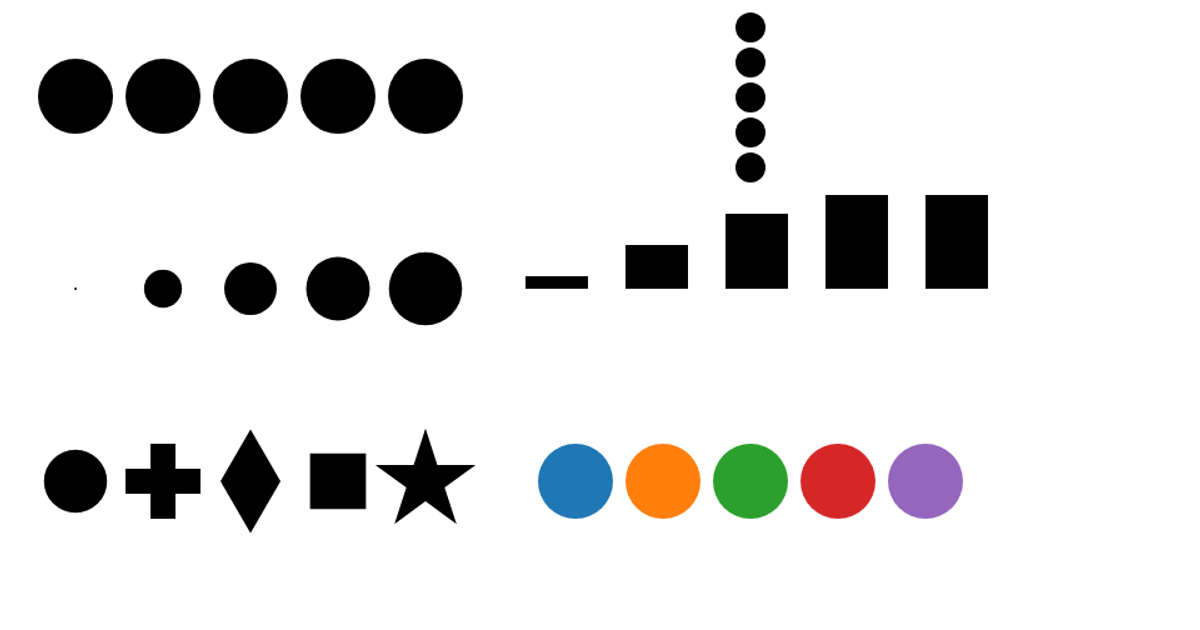
This visualization demonstrates the fundamental D3 concepts of marks and channels by rendering the same five-value dataset across six separate SVG panels. Each panel isolates a single encoding channel: x-position, y-position, circle size, rectangle length, symbol shape, and categorical color. The code uses D3 selections, `selection.join()`, and `selection.each()` to drive the panels, with explicit SVG attributes for positioning, sizing, and styling. It applies `d3.symbol()` for path-based shape generation, `d3.schemeCategory10` for color mapping, and uses modular JavaScript files to keep each channel’s logic separate.
AI-generated descriptionA demonstration of basic D3 usage to implement the concept of Marks and Channels. Includes usage of:
- Point Marks by X, Y, Size
- Line mark varying in length
- Scaling factors
- SVG Rectangles
selection.each()- SVG Path Elements
d3.symbol()- SVG attributes
transformandfill - D3 Color Schemes
- JavaScript Modules
Part of the Constructing Visualizations Playlist.
See also blocks.roadtolarissa.com: Marks and Channels (a vanilla JavaScript version of this).


Comments
Sign in to join the discussion.