🌍 Public
activity 6 q3
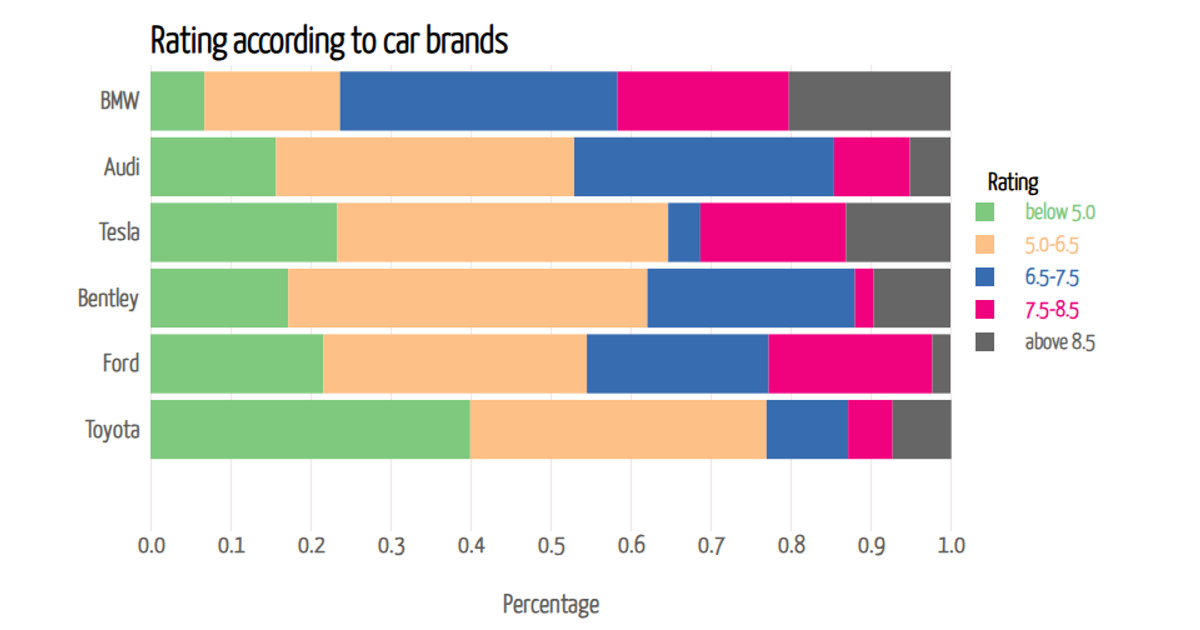
This visualization shows the distribution of movie ratings across different car companies, with each company displayed as a horizontal stacked bar chart. The chart uses percentage values to represent the proportion of ratings in five categories, from below 5.0 to above 8.5. Built with D3 v7, it employs `d3.stack()` for the stacked bar construction, `d3.scaleOrdinal()` for color mapping, and `d3.scaleLinear()` for the x-axis. Interactive tooltips appear on mouseover, displaying the exact percentage for each rating segment. Data is loaded from a CSV file containing company names and their corresponding rating distributions.
AI-generated descriptionThe impact of genre on movie ratings
MIT Licensed


Comments
Sign in to join the discussion.