🌍 Public
A6 BAR CHART
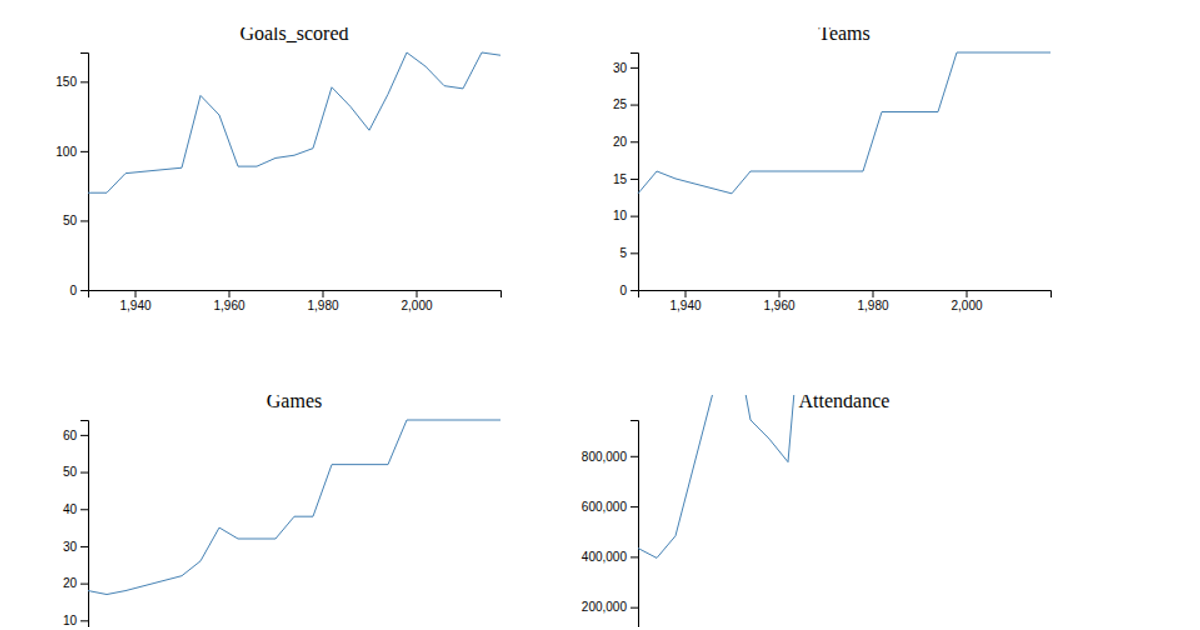
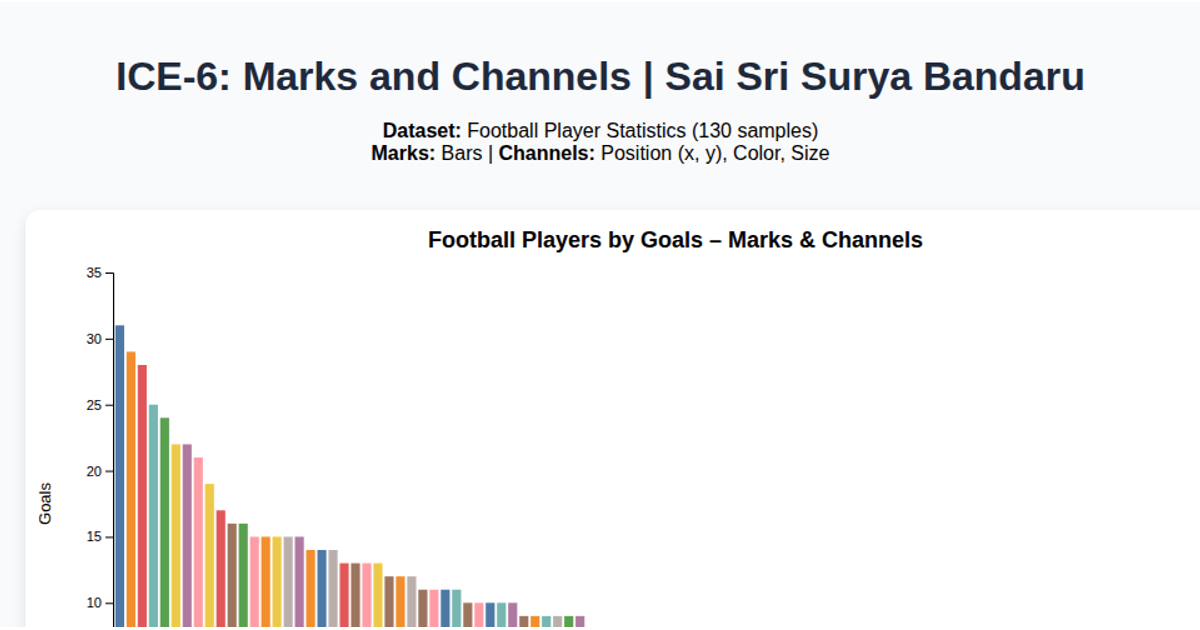
This D3.v7 bar chart visualizes total goals scored in each World Cup year, using a sequential blue color scale where darker bars indicate higher goal counts. The chart loads its data from a CSV file hosted on GitHub, and renders bars as SVG rectangles with rotated x-axis labels for year readability. A legend on the right includes a linear gradient swatch with tick labels, while the color scale is defined via `d3.scaleSequential` and `d3.interpolateBlues`. The code also employs `d3.scaleBand`, `d3.scaleLinear`, and standard axes through `d3.axisBottom` and `d3.axisLeft`.
AI-generated descriptionA bare minimum HTML page demonstrating use of CSS and JavaScript.
See also React Starter.
MIT Licensed




Comments
Sign in to join the discussion.