🌍 Public
Fork of Fork of Working with Time
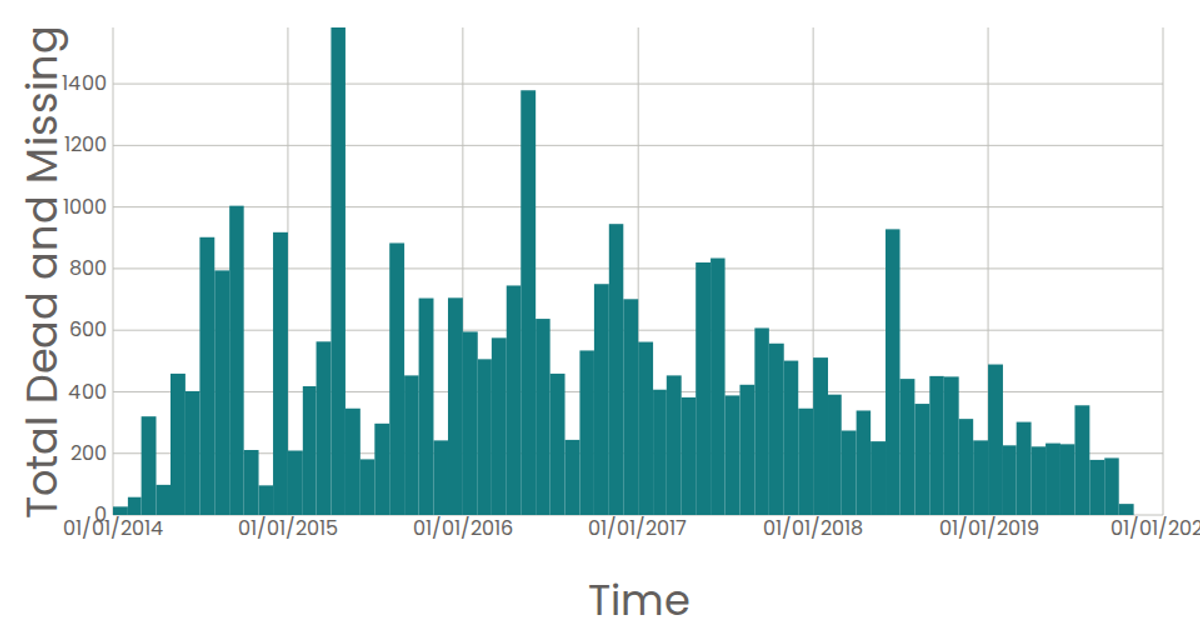
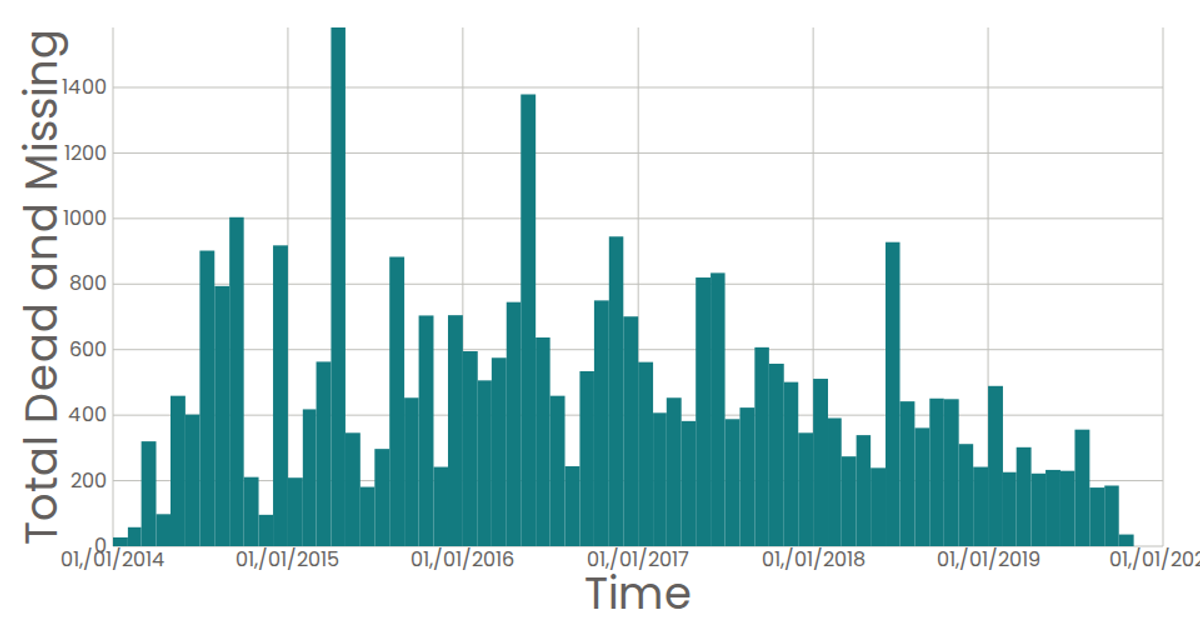
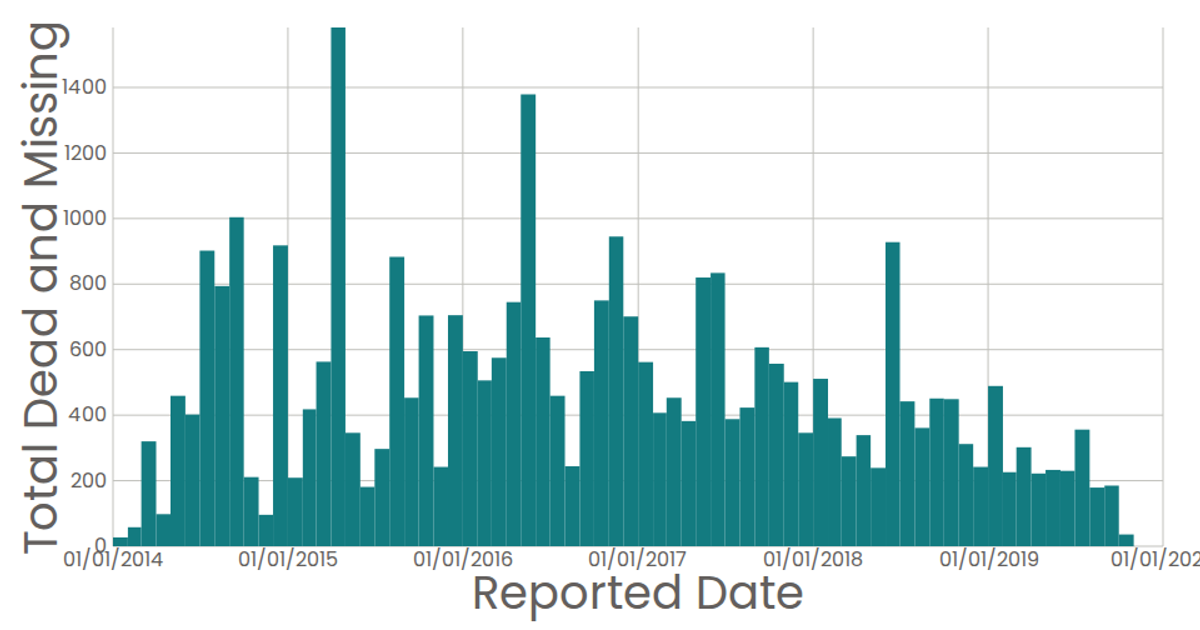
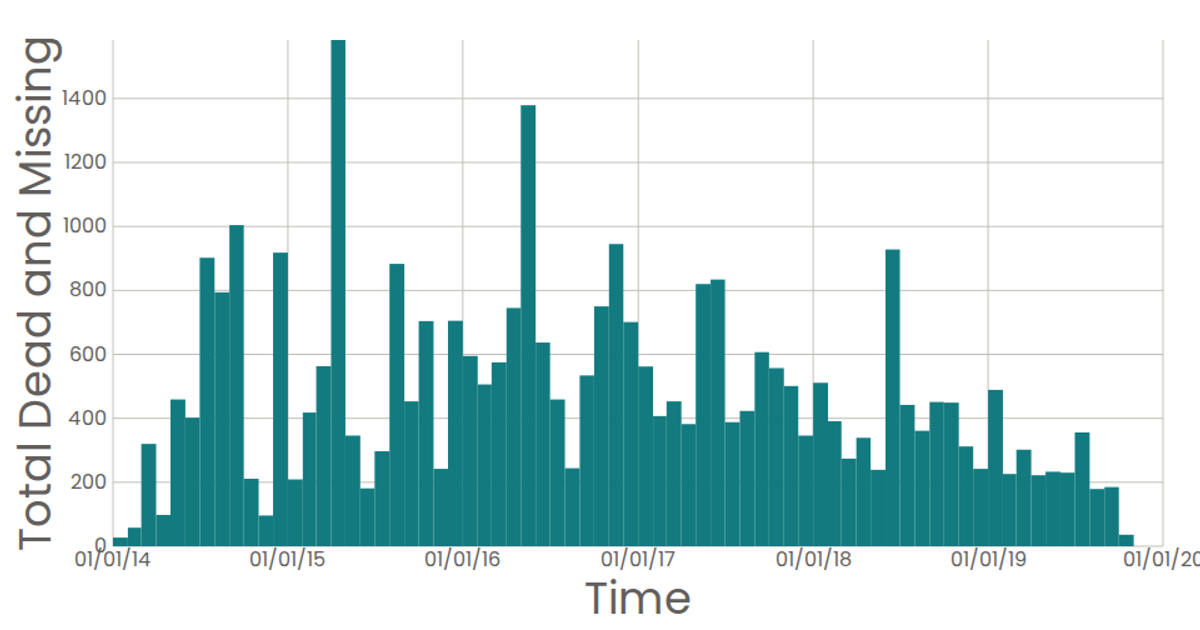
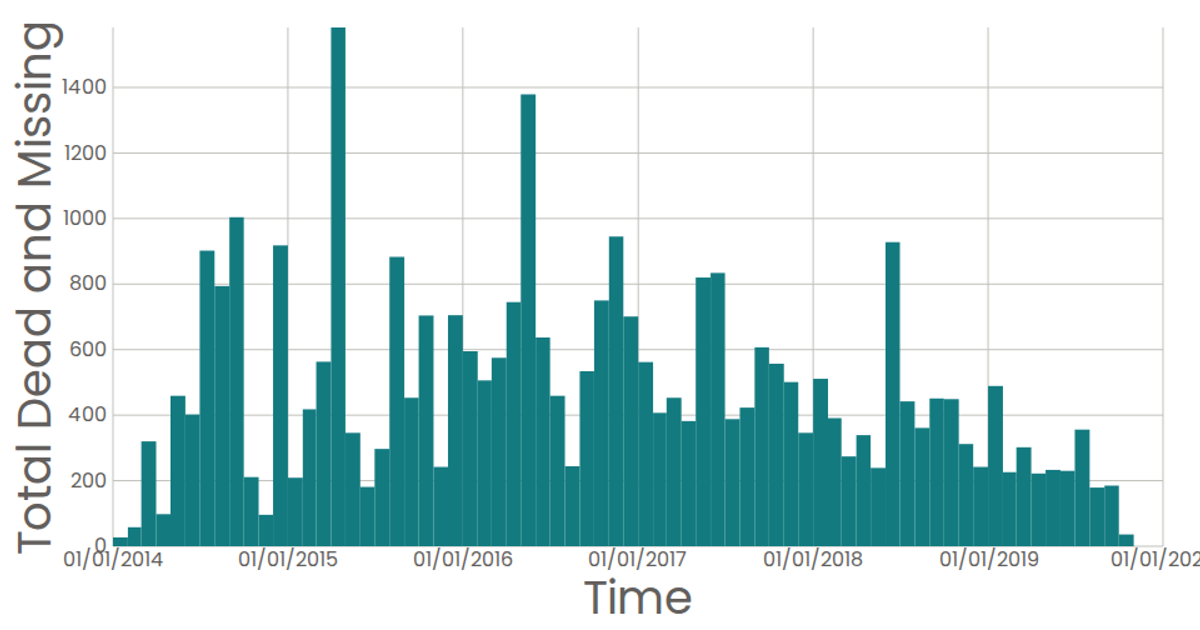
This example visualizes the number of reported missing persons over time, aggregated into monthly bins from a dataset of missing persons reports. The bar chart uses a time scale for the x-axis (showing years) and a linear scale for the y-axis (showing total counts per month). Built with React and D3 v5, it uses `d3.bin` with `timeMonths` thresholds and `d3.sum` to aggregate the data, while custom React components render the SVG axes and marks. The data loads from a CSV file via `d3.csv`.
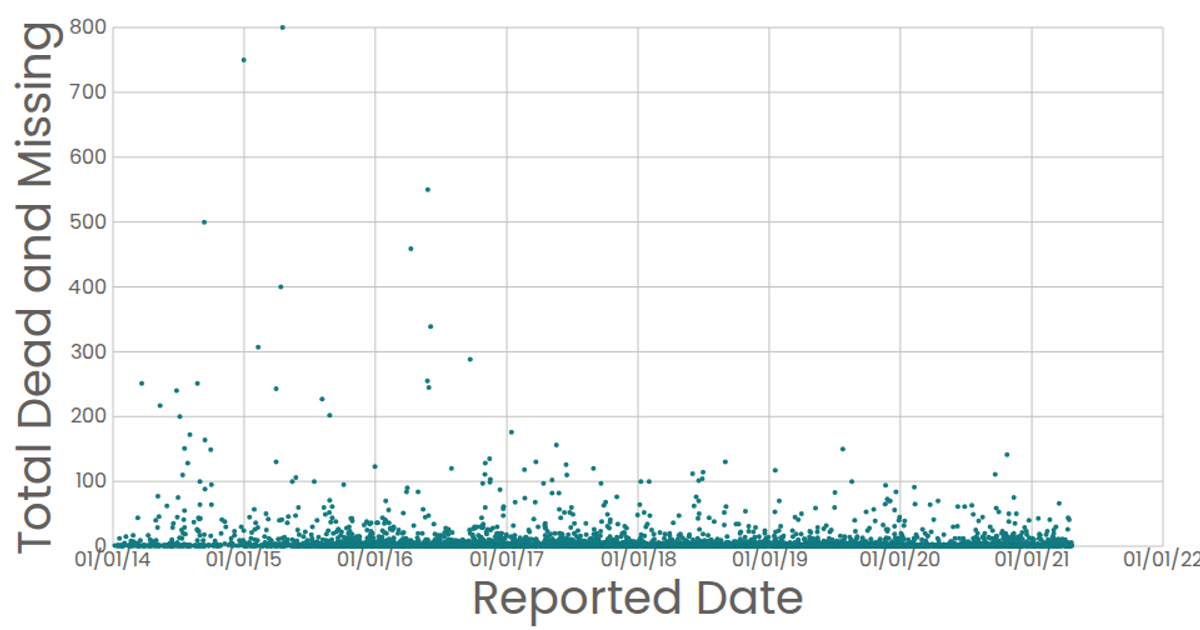
AI-generated descriptionA scatter plot of Data Canvas Sense Your City Dataset.
MIT Licensed


Comments
Sign in to join the discussion.