🌍 Public
Link Tree Viz of World Countries
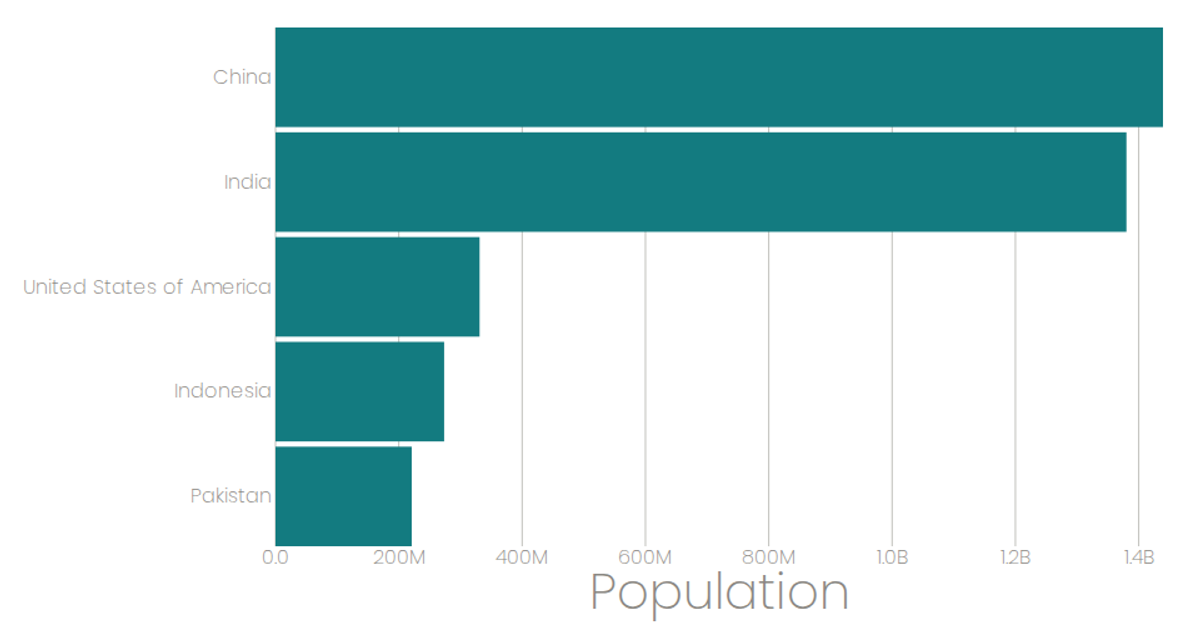
This example displays five circles and five rectangles representing score and population data, with circle size and opacity mapped to scores and bar width corresponding to city populations. Built with React and D3 v5, it uses SVG selections and data joins to bind arrays from `scores.js` and inline city objects. Circles are styled conditionally via CSS classes, while rectangles change fill on hover.
AI-generated descriptionA bare minimum HTML page.
See also React Starter.
MIT Licensed




Comments
Sign in to join the discussion.