🌍 Public
Nikita's Area Chart
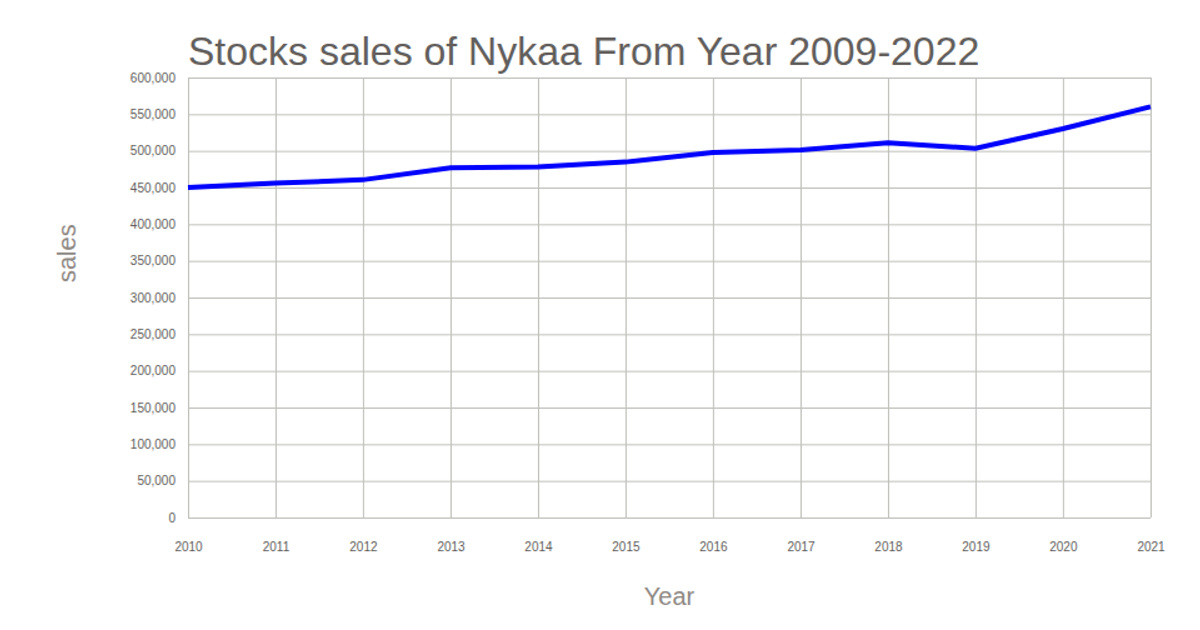
This area chart displays Nykaa’s stock sales from 2009 to 2022, using a smooth curve to show sales trends over time. D3 v5 with SVG renders both a black line for the data and a filled navy area beneath it, with labeled axes for year and sales. The code uses `d3.csv` to load the data, `scaleLinear` for both axes, and `line` and `area` generators with `curveBasis`. Gridlines and tick formatting are applied via `d3.axisBottom` and `d3.axisLeft`.
AI-generated descriptioncombined line and area charts
MIT Licensed




Comments
Sign in to join the discussion.