🌍 Public
Force-Directed Graph & Adjacency Matrix- D3.js
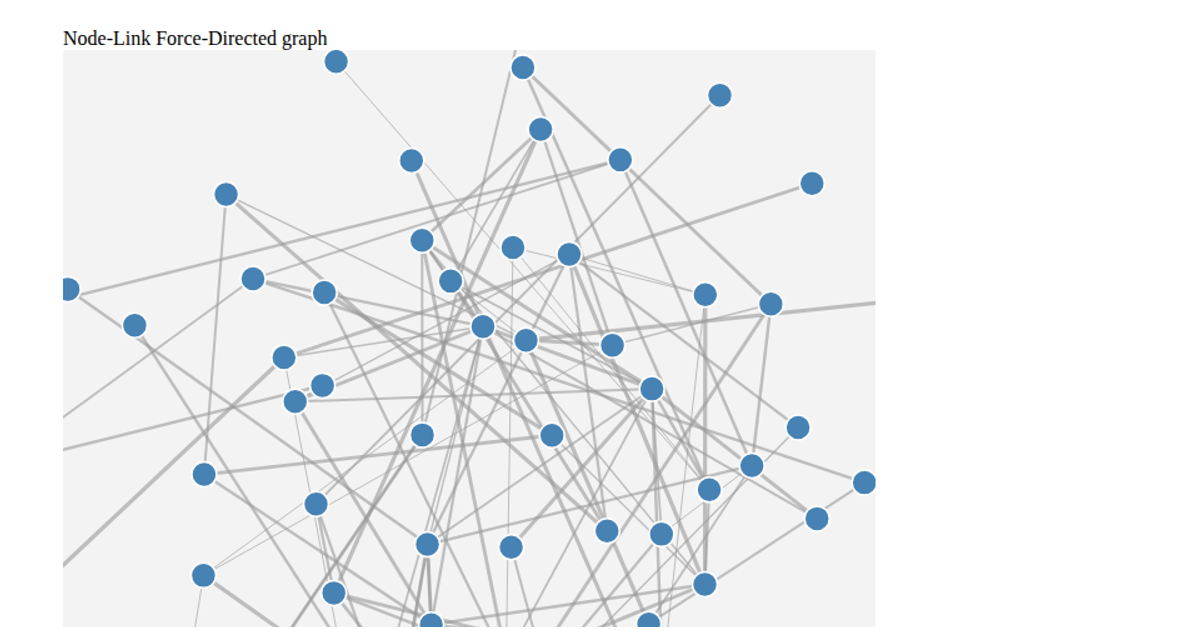
This example pairs a force-directed graph with an adjacency matrix to visualize relationships from a food-themed CSV dataset. The graph uses `d3.forceSimulation` with link and charge forces to position nodes, while draggable circles represent entities. The adjacency matrix uses SVG rectangles, with fill opacity scaled by edge weight, and includes interactive tooltips on mouseover. Both views share the same node-link data, rendered in SVG with animation. The code relies on D3.js v6 APIs including `d3.csv`, `d3.forceLink`, `d3.drag`, and `.join()`.
AI-generated descriptionMIT Licensed



Comments
Sign in to join the discussion.