🌍 Public
Fork of Fork of NASCAR history of drivers and tracks
Xxieyunli111
Last edited Mar 3, 2023
Created on Mar 3, 2023
Forked from Fork of NASCAR history of drivers and tracks
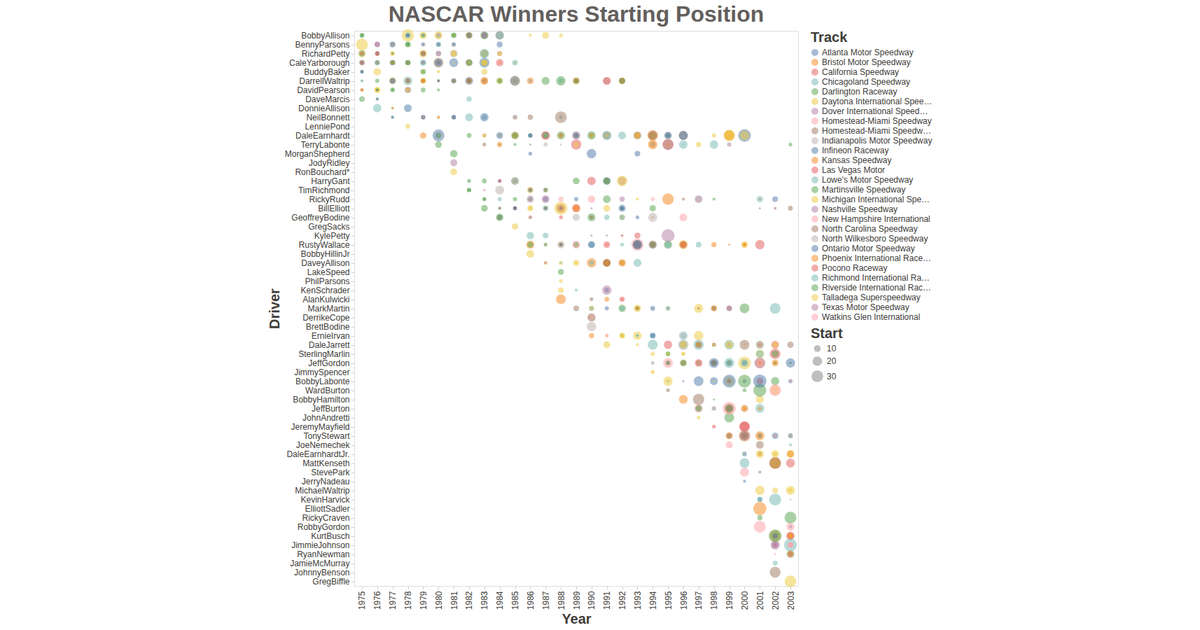
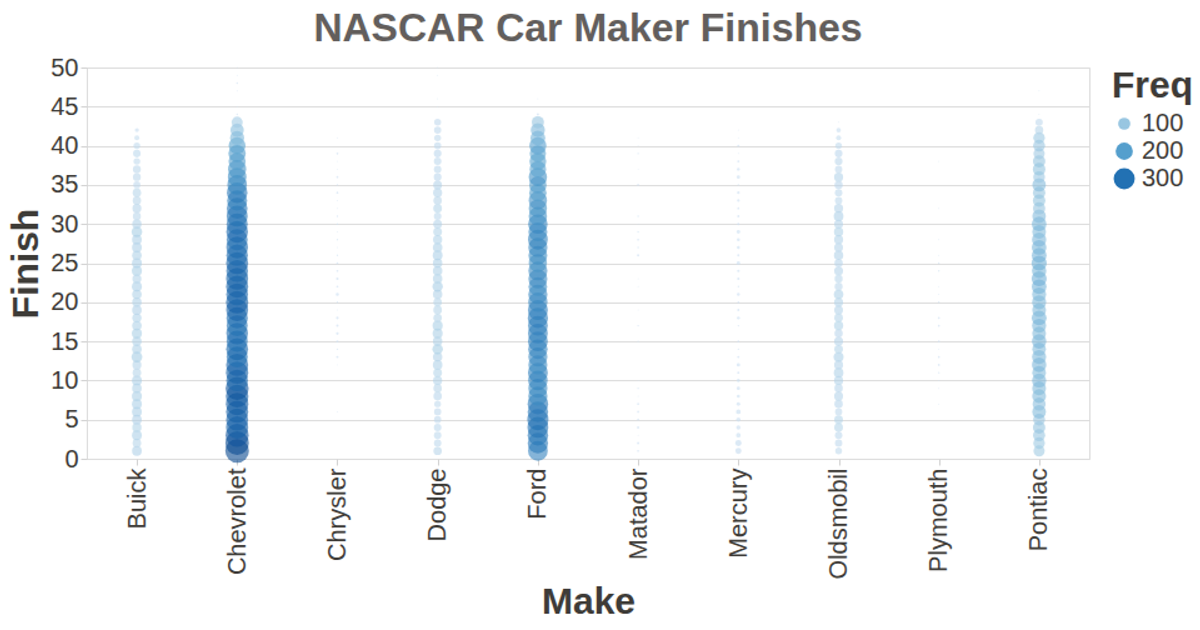
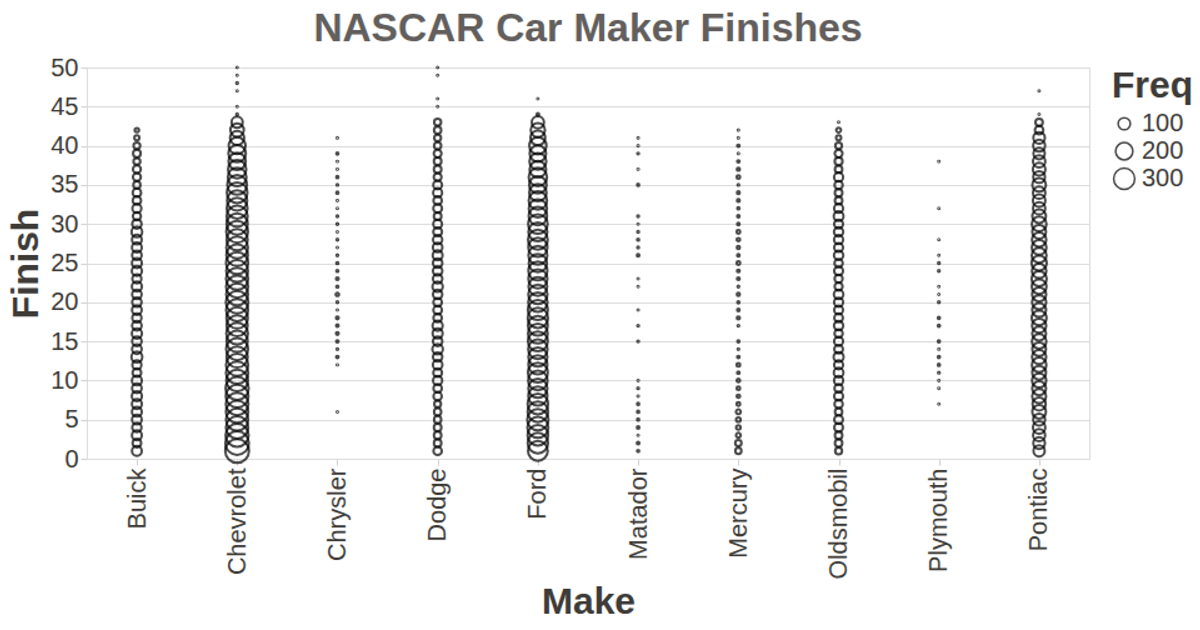
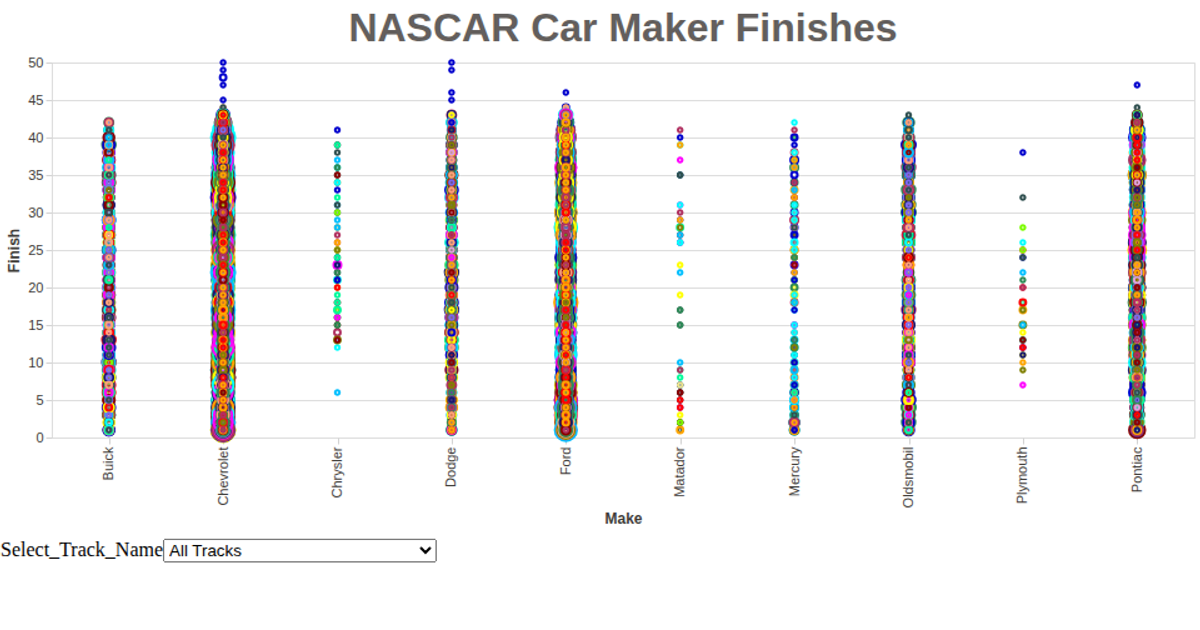
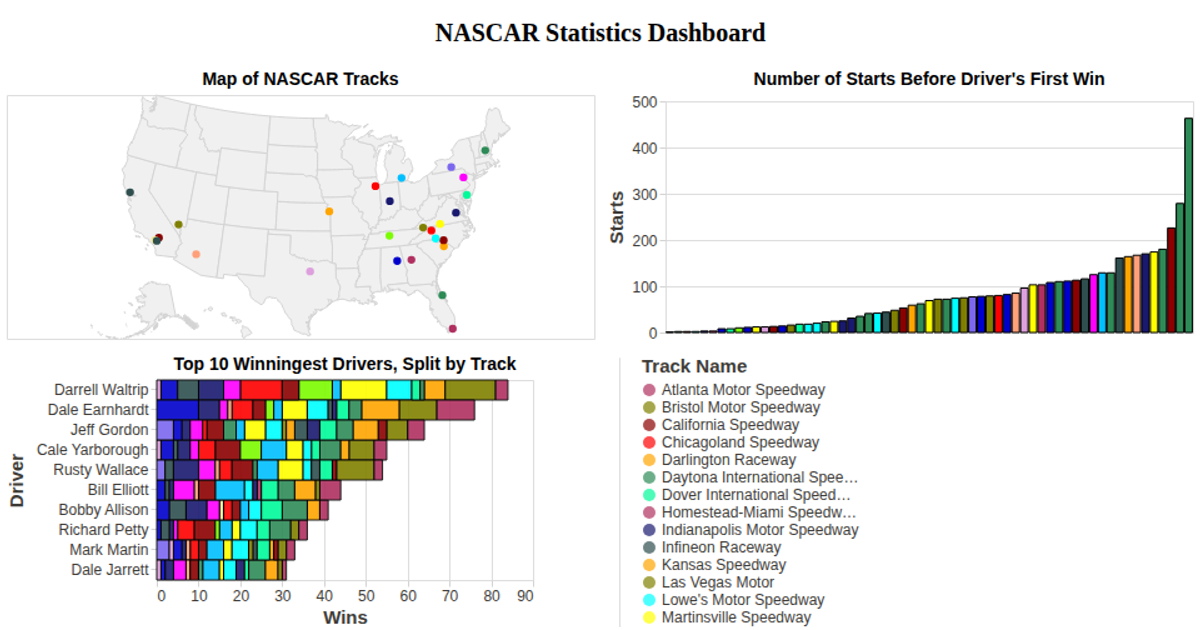
This visualization displays a capability matrix for an organization across multiple scenarios, using a bubble chart where each circle represents a capability within a specific scenario. The x-axis lists scenarios, the y-axis lists capabilities, circle size encodes the Finish metric, and color represents completion percentage. Built with Vega-Lite API, the chart uses `vl.markCircle()`, `vl.x().fieldN()`, `vl.y().fieldN()`, `vl.size().fieldQ()`, and `vl.color().fieldN()` encodings. Data is loaded from a local CSV file via `d3.csv()`, with tooltips showing scenario and capability details.
AI-generated descriptionExploring the dataset.
MIT Licensed


Comments
Sign in to join the discussion.