🌍 Public
CSCE 5320 HW5
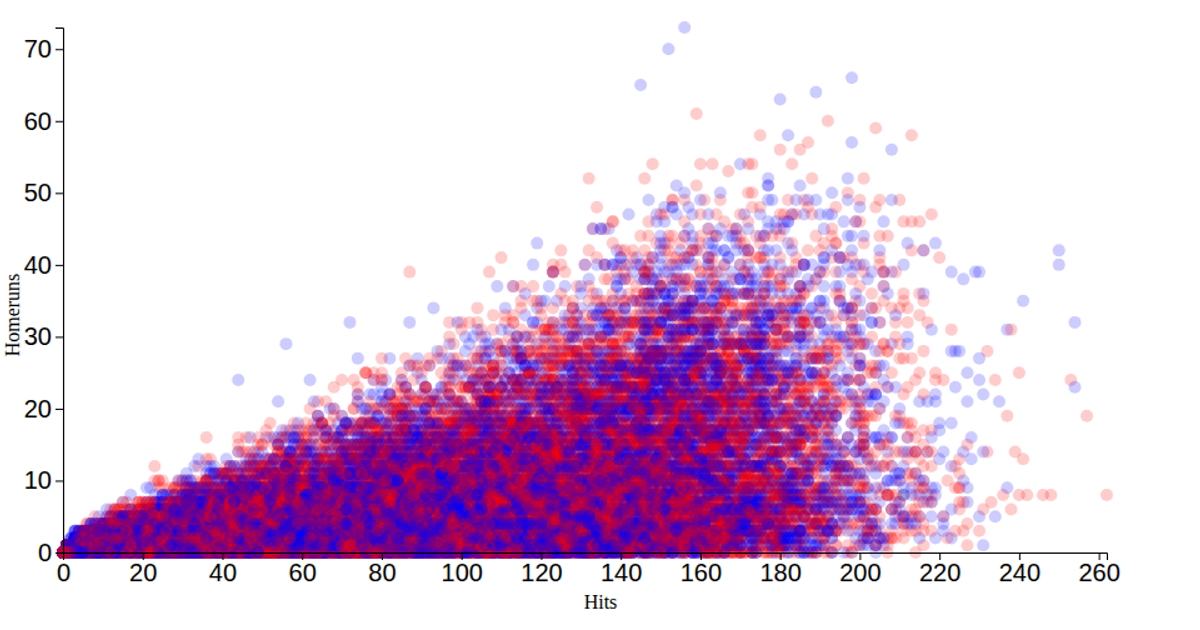
This example visualizes individual player statistics for the San Diego Padres, using home runs (HR) on the x-axis and batting average (BA) on the y-axis. It also encodes position as color and RBI as bubble size, with axes and labels styled for dark background. The code loads CSV data via `d3.csv`, applies numeric conversion, and uses `d3.scaleLinear` for positioning plus `d3.mean` and `d3.median` to summarize statistics in a header. Marks are drawn as colored circles with white strokes inside a single SVG group, and the chart includes a legend area on the right margin.
AI-generated descriptionMIT Licensed




Comments
Sign in to join the discussion.