🌍 Public
Line Chart Transition
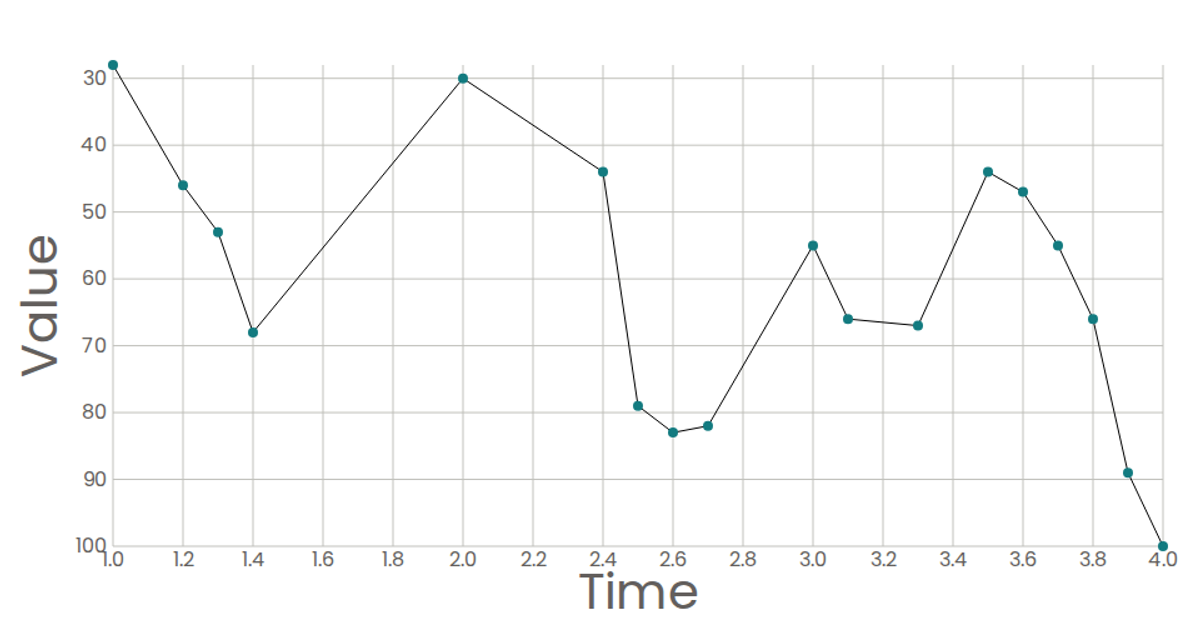
This example shows a line chart drawing itself with a smooth stroke animation using d3.line and transition.attrTween, which interpolates the stroke-dasharray to simulate a pen-like drawing effect. The chart maps time and value fields from a CSV file (data.csv) to a time-scale x-axis and linear y-axis, rendering axes with d3.axisBottom and d3.axisLeft. The visualization is built with D3 v4, uses SVG elements, and is responsive, redrawing on window resize.
AI-generated descriptionMIT Licensed





Comments
Sign in to join the discussion.