🌍 Public
[SR] next try: Scatter Plot with Menu
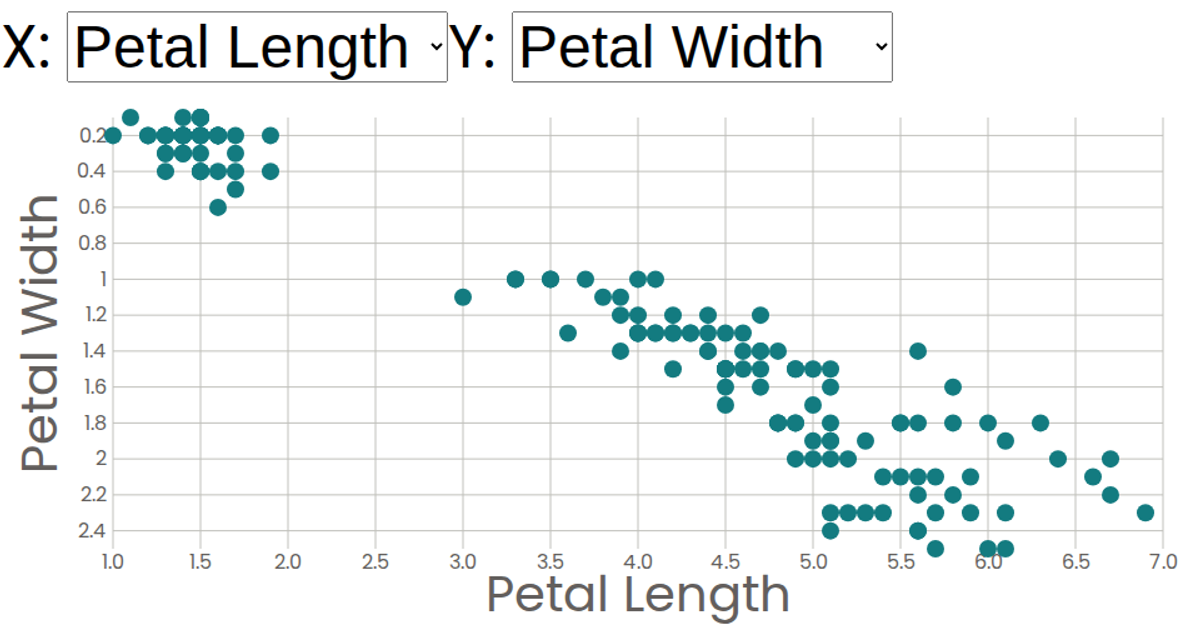
This interactive scatter plot visualizes the Iris dataset, allowing users to select which flower measurements to plot on the x and y axes via two dropdown menus. The visualization uses React for the user interface and D3.js for rendering the SVG elements, including axes, data points, and a color legend. By hovering over the legend, the plot highlights data points of a selected species while dimming others. The chart's data is loaded asynchronously from a CSV file using D3's `csv` function.
AI-generated descriptionA scatter plot of The Iris Dataset.
MIT Licensed



Comments
Sign in to join the discussion.