🌍 Public
Smoothed D3.js Radar Chart
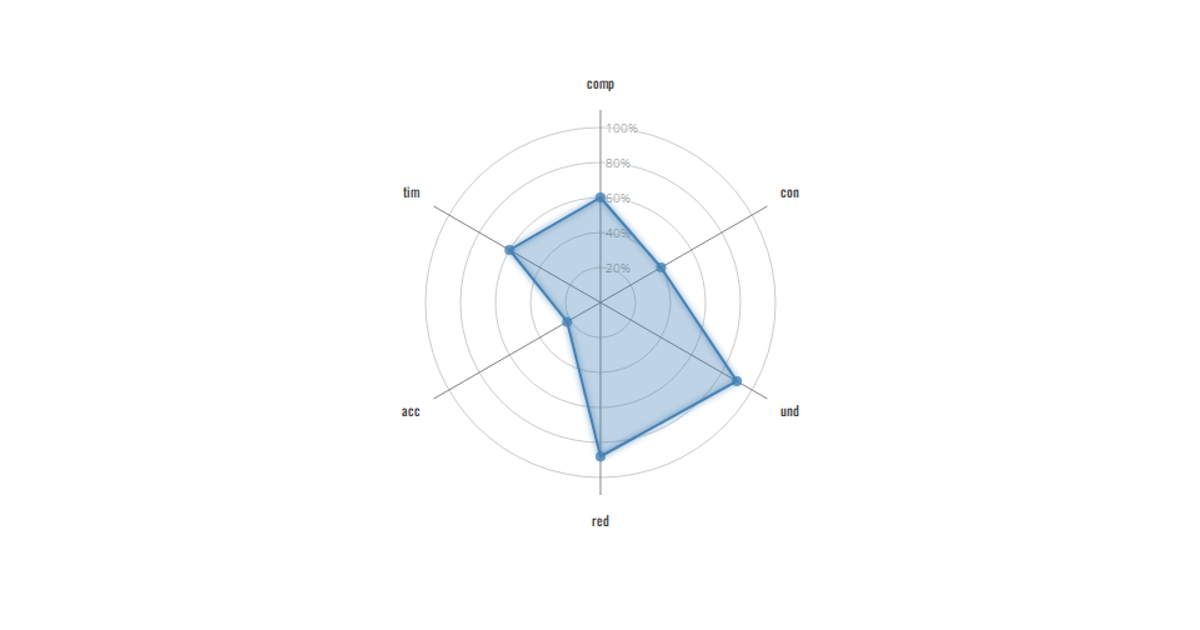
This smoothed D3.js radar chart displays the proportional breakdown of COVID-19 transmission types, including travel-related, close contact, community transmission, and under investigation, across five defined geographic regions. The visualization uses a circular grid with five concentric levels, where each axis represents a transmission category and the filled area shows the aggregated values. Built with D3.js v3, it employs the `d3.scale.linear` for radius mapping and `d3.scale.ordinal` for color assignment, rendering as an SVG with animated glow effects. The chart reads from a static dataset of transmission percentages and displays the data as a single smoothed polygon.
AI-generated descriptionMIT Licensed



Comments
Sign in to join the discussion.