🌍 Public
formationBusinessesTX
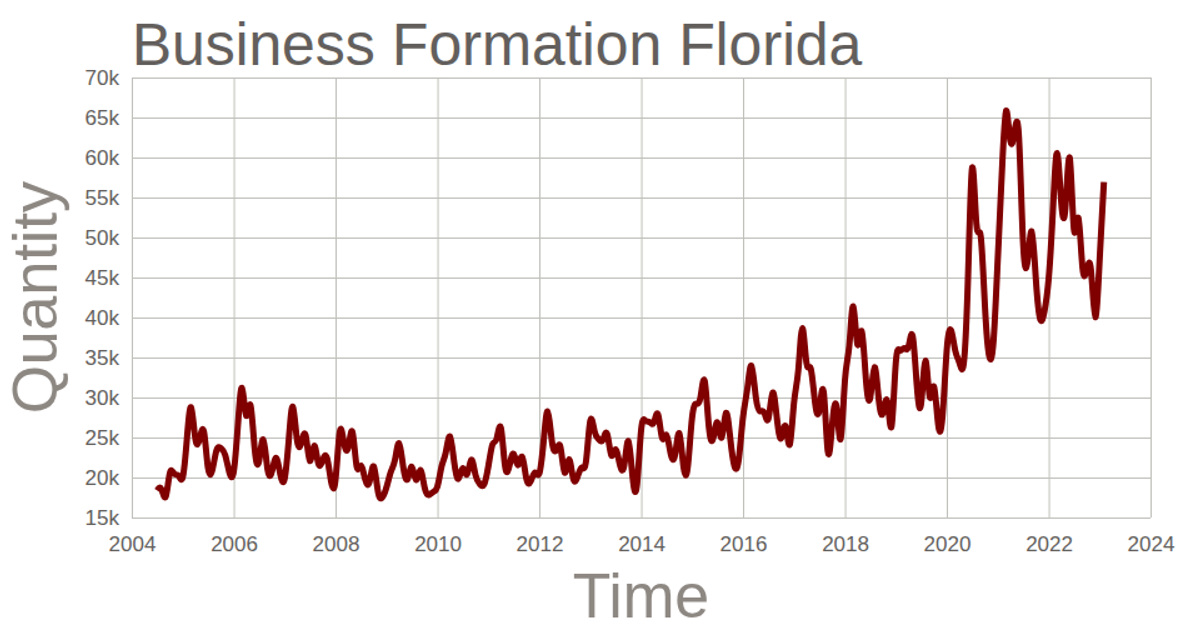
This chart displays the cumulative quantity of business formations in Texas over time, plotted as a smooth line. The visualization is built with D3.js v5 and renders to an SVG canvas. It uses `scaleTime` and `scaleLinear` for the axes, with a `curveBasis` line generator to create the smoothed trend. The data, sourced from a CSV file, includes a two-value Y-axis label and tick formatting that abbreviates large numbers. The chart updates only after loading and parsing the external dataset.
AI-generated descriptionThis line chart shows one week of temperature (in degrees Celcius) in San Francisco. The data comes from Data Canvas - Sense Your City.
Made in this video:
MIT Licensed





Comments
Sign in to join the discussion.