🌍 Public
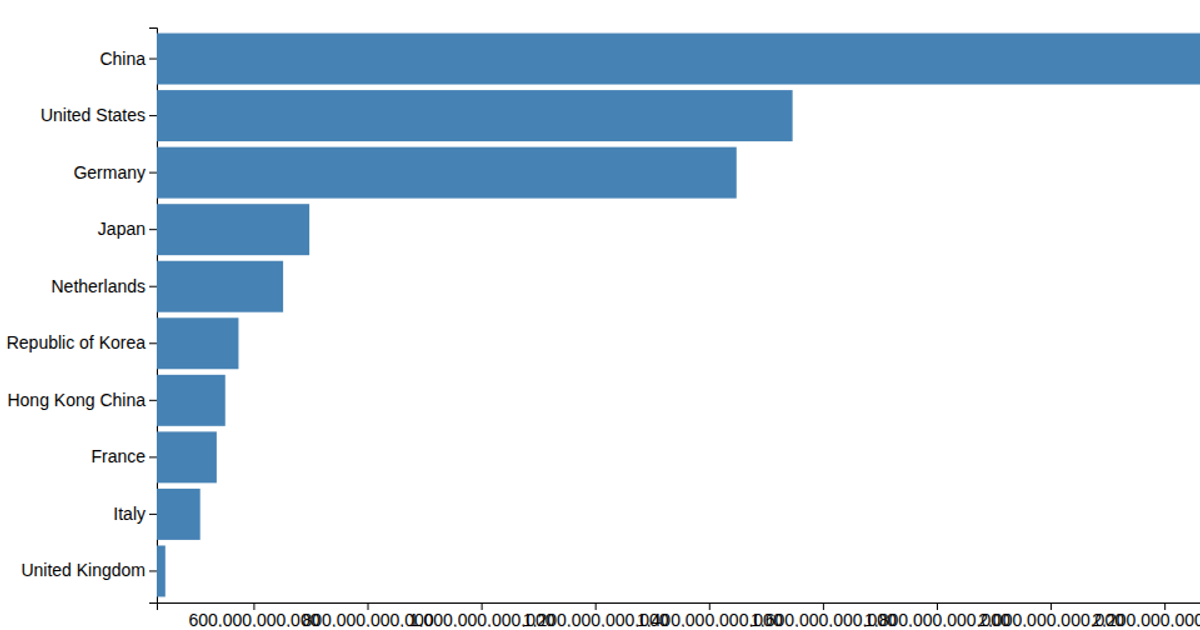
Ingresos de exportación por región durante el 2019
A horizontal bar chart displays 2019 export revenues by region, with bars ordered from highest (América del Norte) to lowest (Medio Oriente) and numeric values on a linear scale. The visualization uses D3 v5 with `scaleBand` and `scaleLinear` for axes, `axisLeft` and `axisBottom` for ticks, and SVG rendering. Data is loaded from a local CSV file via `d3.csv`. Interactive features include mouseover tooltips showing region and revenue values and click alerts, implemented through D3 event handlers on the bars.
AI-generated descriptionIngresos por concepto de exportación por región durante el 2019
MIT Licensed




Comments
Sign in to join the discussion.