🌍 Public
Exercise 5
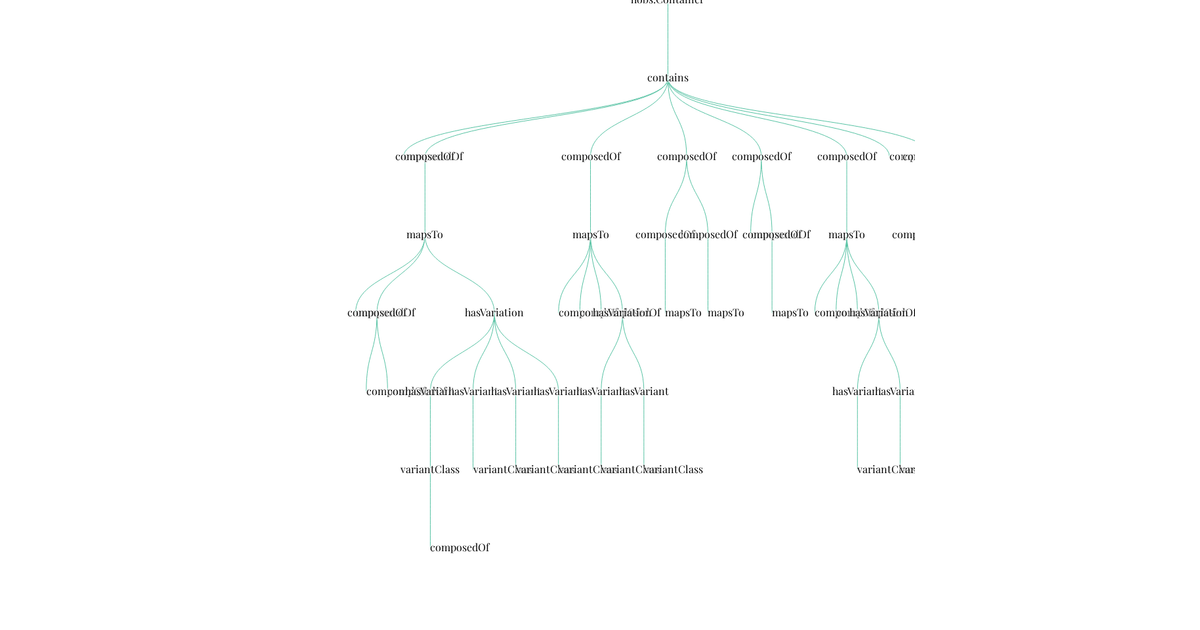
This example shows a hierarchical tree visualization generated from a JSON data source, representing the structure of an “antimony” object. The code uses the D3.js library to compute the tree layout and render the relationships as a series of horizontal links. It relies on `d3.hierarchy` to process the data, `d3.tree` for layout calculations, and `d3.linkHorizontal` to generate SVG path data for each connection, which are then appended to the SVG canvas. The visualization animates the complete dataset at once, displaying the entire tree structure without interaction.
AI-generated descriptionMIT Licensed


Comments
Sign in to join the discussion.