🌍 Public
TRUE Successful Refactored Bar Chart
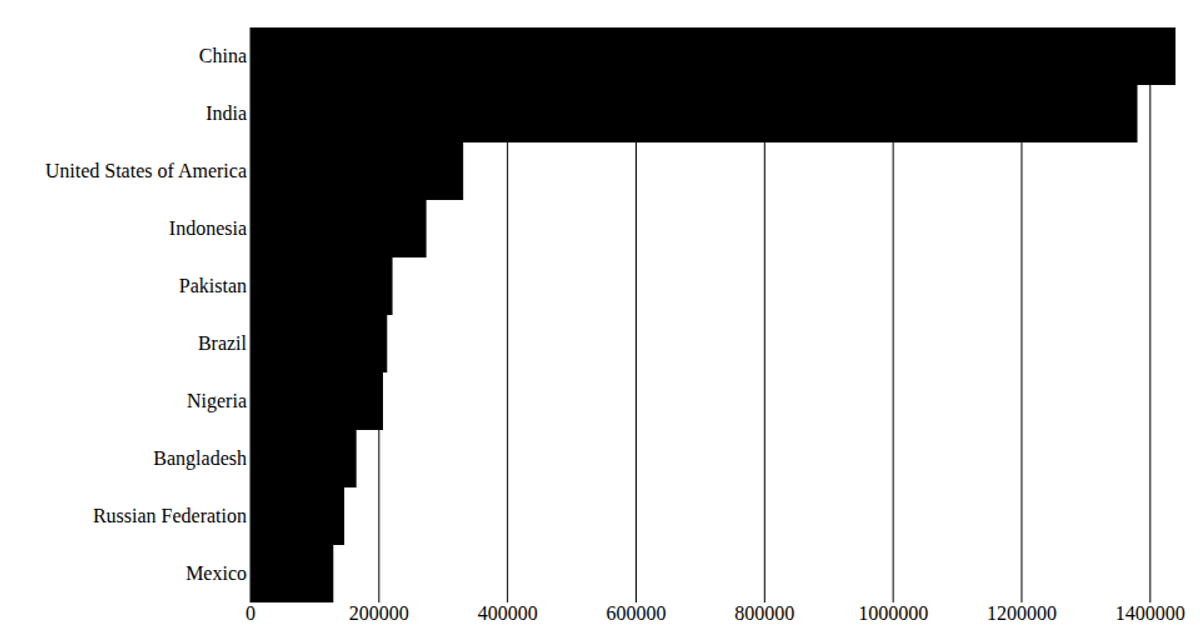
This bar chart displays the population of the top 10 countries for the year 2020, sourced from a CSV file of UN population data. The chart uses React with D3 v7, rendering SVG elements through custom components for the axes and bars. D3’s `scaleBand` and `scaleLinear` position the bars, while React hooks (`useState`, `useEffect`) manage data loading via `d3.csv`. The visualization highlights a refactored structure with separate components for bottom and left axes and marks.
AI-generated descriptionUses React to render data
MIT Licensed



Comments
Sign in to join the discussion.