🌍 Public
itsa bar chart!
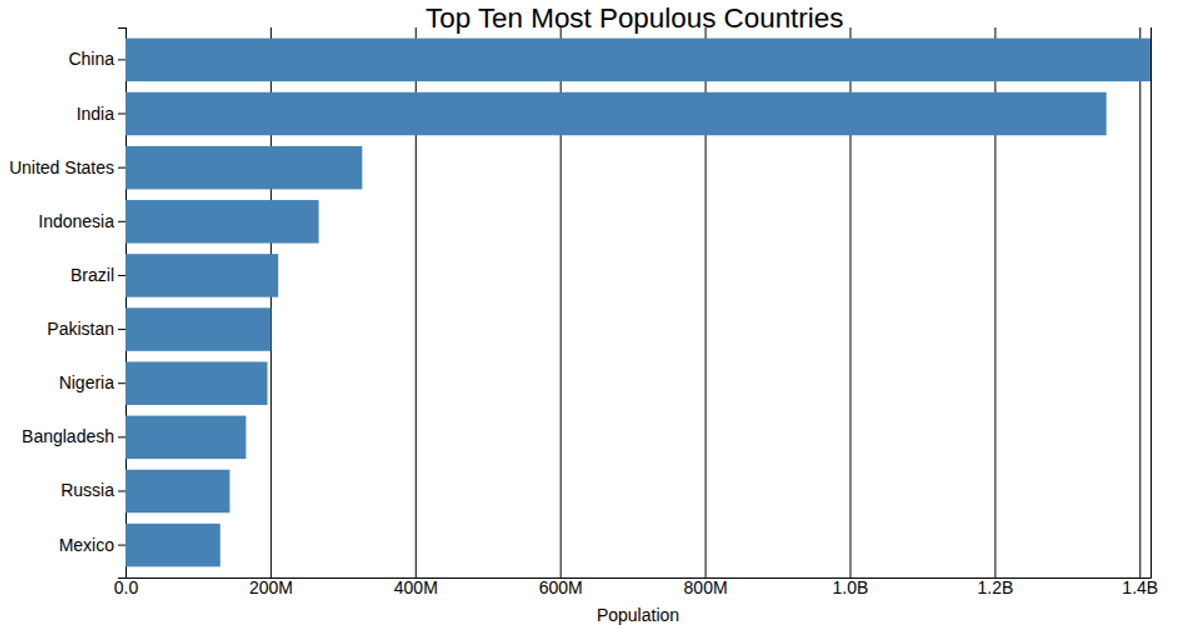
This bar chart visualizes the population of the ten most populous countries, using horizontal bars to compare values. The chart is rendered as an SVG using D3 v5, with a linear scale for population values and a band scale for country names. The data is loaded from a CSV file and multiplied by 1,000 to display the actual population numbers. The chart uses `d3.scaleLinear`, `d3.scaleBand`, `d3.axisLeft`, and `d3.axisBottom` to construct the axes and bars.
AI-generated descriptionMIT Licensed




Comments
Sign in to join the discussion.