🌍 Public
Making a bar chart
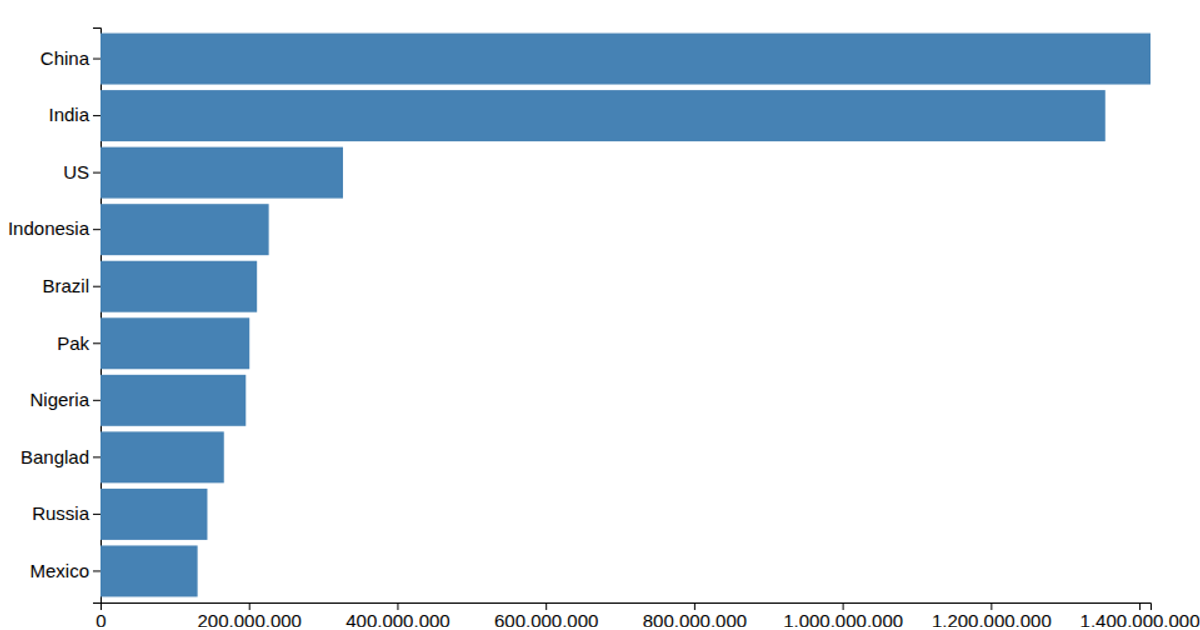
This example renders a static bar chart without axes or labels, showing population estimates for ten countries from a CSV file. It uses D3’s `select` to target the SVG element and the `csv` function to load and parse the data, converting the population strings to numbers by multiplying by 1000. The code then appends rectangles for each data row, but all bars are drawn with the same width and height (300 units), so the visual does not reflect the data values. The chart is rendered as SVG via D3, with no layout or scaling logic applied.
AI-generated descriptionMIT Licensed






Comments
Sign in to join the discussion.