🌍 Public
GBCL
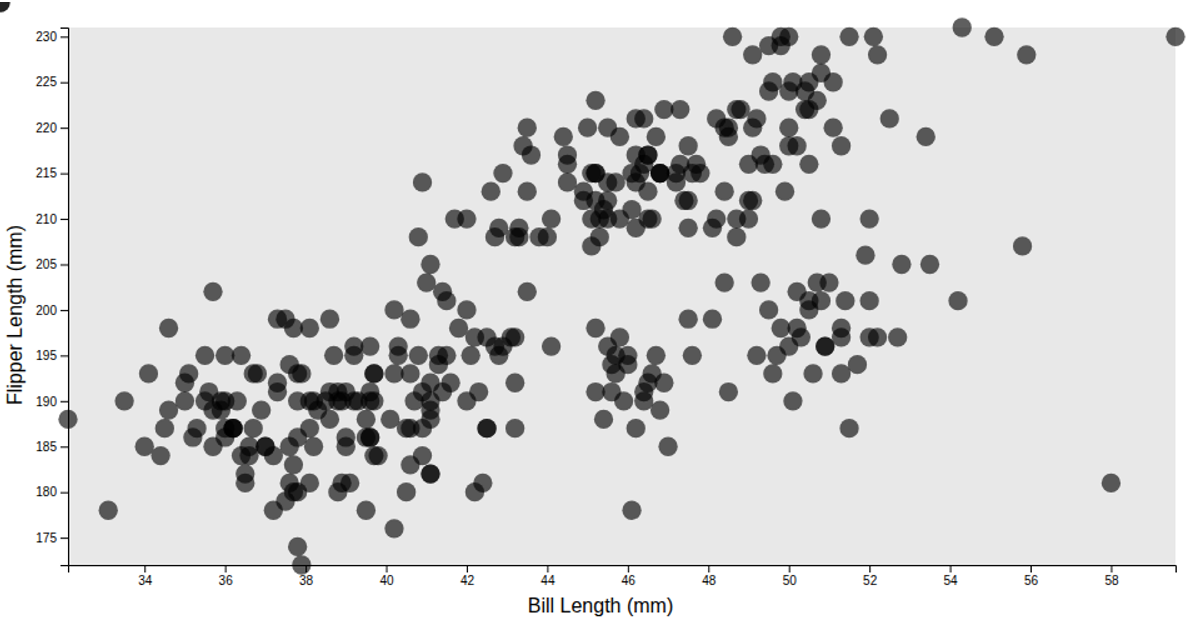
This visualization displays a scatter plot of penguin bill length against flipper length, using data from the @curran/penguins dataset. It filters out incomplete records with `Array.filter` and `isNaN` before rendering. The chart is built with d3 scales (`scaleLinear`), axes (`axisLeft`), and positioned circles, with a gray inner rectangle and translucent points. Axis labels are added via the @curran/axis-labels package.
AI-generated descriptionA demonstration of how to filter out missing data, leveraging Array.filter and isNaN.
const filteredData = data.filter(
  (d) => !(isNaN(xValue(d)) || isNaN(yValue(d))),
);
MIT Licensed




Comments
Sign in to join the discussion.