🌍 Public
Actor Graph
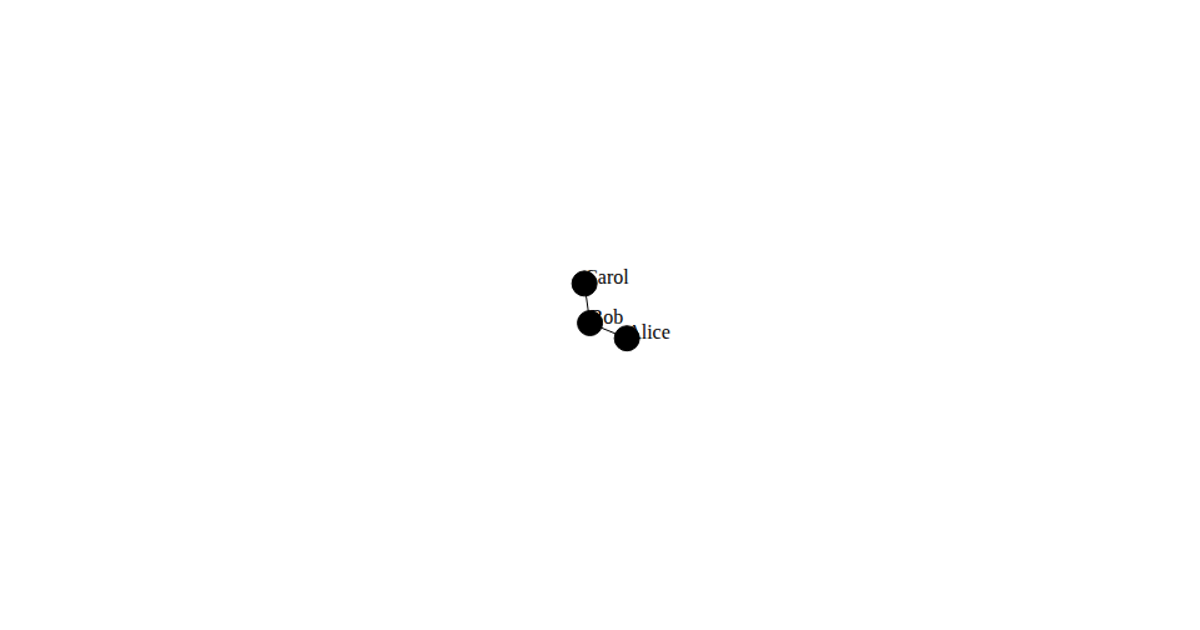
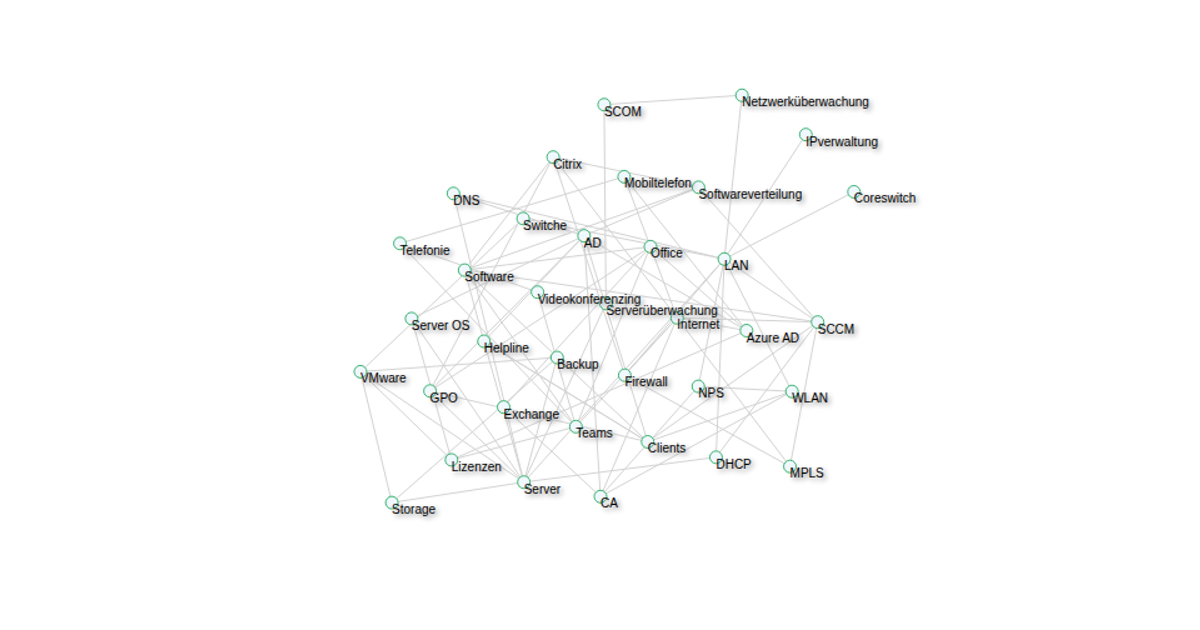
This interactive network visualizes the connections between software applications and IT systems, from a dataset of application names and the interfaces linking them. The force-directed graph uses circle nodes for each application and grey lines for their relationships. The visualization is constructed with d3.forceSimulation, d3.forceManyBody, d3.forceLink, d3.forceCenter, d3.forceCollide, and implements a drag interaction.
AI-generated descriptionCreating a force-directed graph, based on data of two csv-files.
Sources:
- Scatter Plot: https://www.youtube.com/watch?v=xkBheRZTkaw&t=37528s
- force-directed graph: https://www.youtube.com/watch?v=y7DxbW9nwmo
- documentation: https://github.com/d3/d3-force
- Accessor with named sources and targets: https://github.com/d3/d3-force#link_id
Text, Color, Drag: https://youtu.be/y7DxbW9nwmo?t=1696
Filter:
open issues:
- count number of links -> change force (number of links > 1 -> push appart / number of links < 1 -> force together)
- add arrows to links
- change interf.csv (wrong source data for filters)
- add filter options
MIT Licensed






Comments
Sign in to join the discussion.