🌍 Public
Social Network Graph-ICE 8_Archana Goli
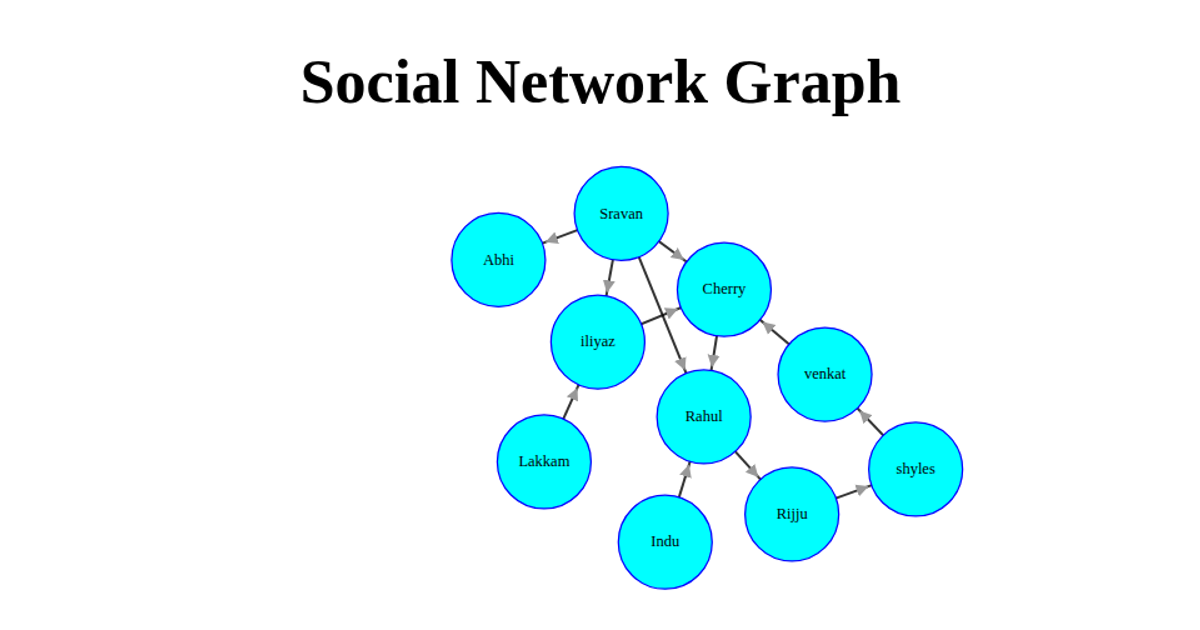
This visualization presents a social network graph of the software development lifecycle, mapping project workflow phases—from planning through maintenance—as interconnected nodes. Built with D3.js v6, the graph uses `d3.forceSimulation` along with `forceLink` and `forceManyBody` to position nodes and edges dynamically. Force-directed layout positions 35 nodes and 34 links from the loaded `data.json` file, with node sizes and stroke widths reflecting link values. Users can drag nodes interactively via D3’s `drag` behavior, while the simulation updates edge coordinates on each tick event. Pink circular nodes with navy labels are rendered as SVG elements on a skyblue background.
AI-generated descriptionMIT Licensed



Comments
Sign in to join the discussion.