🌍 Public
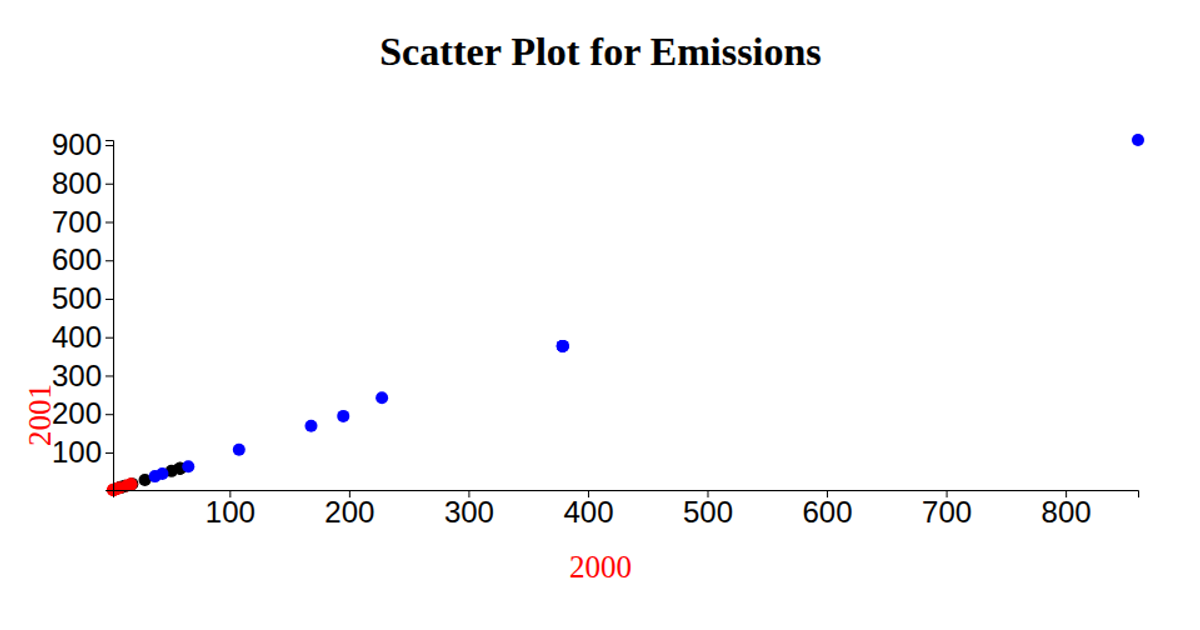
Simple Scatter Plot of CEI and GCI
This scatter plot visualizes the relationship between the Cybersecurity Exposure Index (CEI) and the Global Cyber Security Index (GCI) for various countries. It uses a light gray inner rectangle to frame each data point, with circular markers whose size and opacity are derived from code constants. The visualization relies on D3’s `scaleLinear` for axis scaling and `axisLeft` for the y-axis, while axis labels are generated via the `@curran/axis-labels` utility. The data originates from a Kaggle dataset on cyber security indexes.
AI-generated descriptionThe Cyber Security Index loaded to dispaly a simple scatterplot of CEI and GCI
MIT Licensed



Comments
Sign in to join the discussion.