🌍 Public
select_example
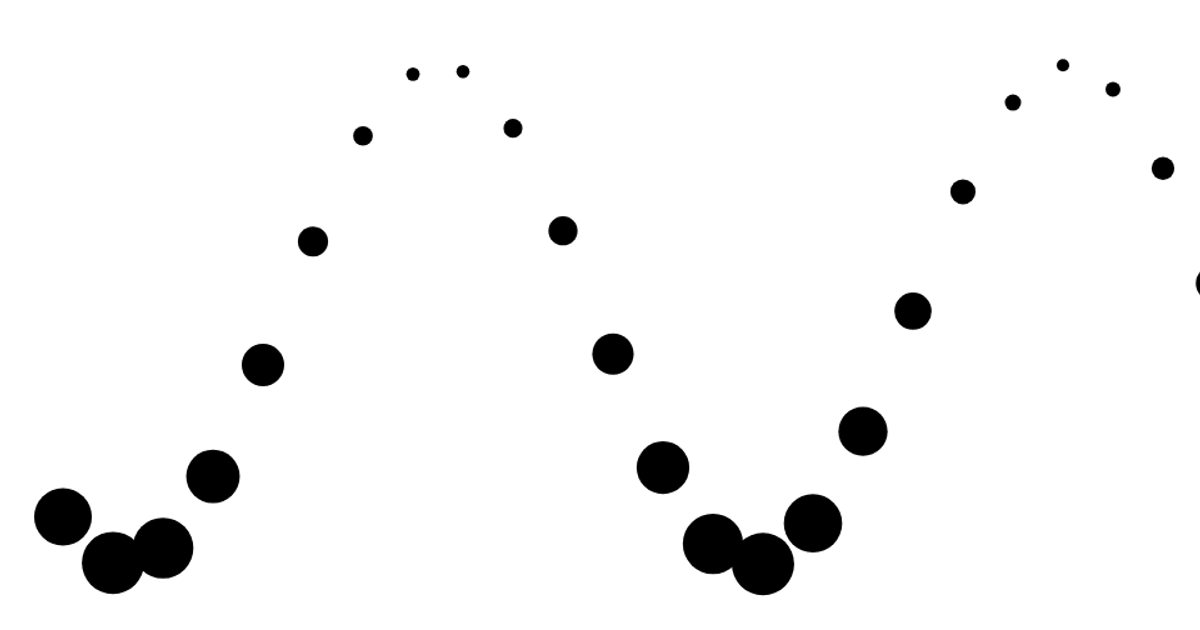
A set of twenty circles animates vertically in a sine-wave pattern across the screen, using color and position to create a flowing, undulating line. The visualization is built with D3.js, leveraging the `select`, `range`, and `selectAll` APIs to bind data and update the SVG elements. Each frame, the circle’s y-coordinate is recalculated based on a sine function with a phase shift, producing smooth motion at 40 frames per second. The SVG canvas fills the entire browser window, and the animation runs continuously in a loop.
AI-generated descriptionAdd element whit select in d3
MIT Licensed




Comments
Sign in to join the discussion.