🌍 Public
Histogram, Binned Data, Missing Migrants (codeAlong)
This histogram visualizes the total number of dead and missing migrants per month, using data from the Missing Migrants Project. The code relies on d3.histogram to bin the reported dates into monthly intervals and d3.sum to aggregate the death counts within each bin. React renders the SVG axes and rectangular marks, while d3.scaleTime and d3.scaleLinear map the time and count scales.
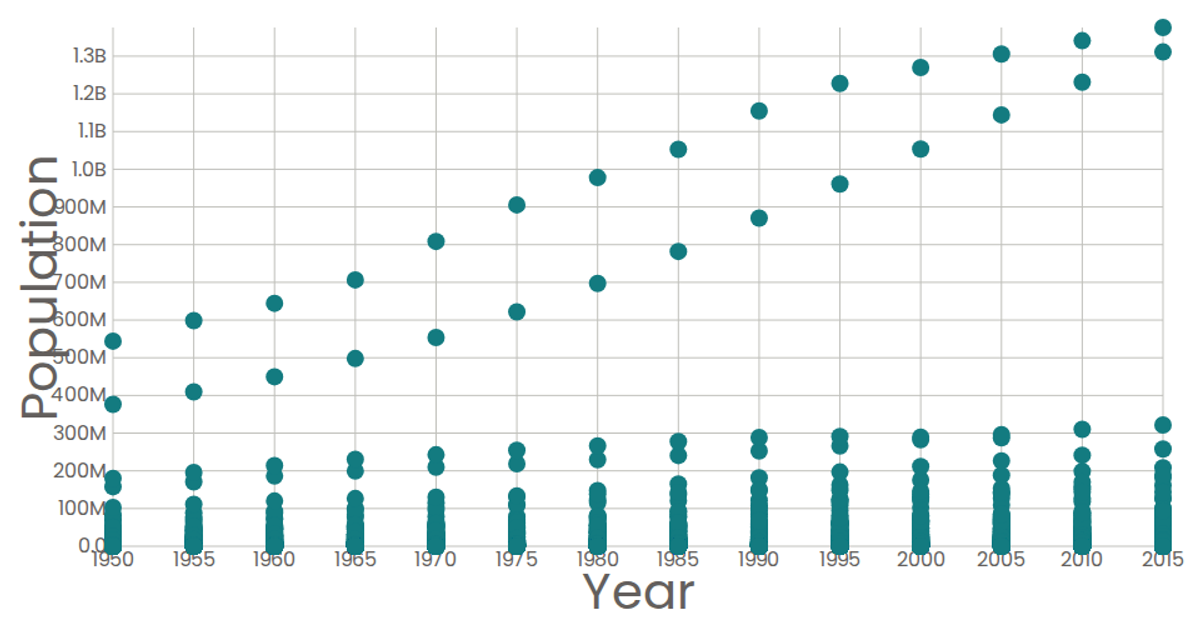
AI-generated descriptionChanging the scatter plot to take in new data with time being on the x axis.
MIT Licensed




Comments
Sign in to join the discussion.