🌍 Public
Fork of ICE-6: Rendering Marks and Channels with React & D3
Kkarnisrikanth2212
Last edited Mar 11, 2023
Created on Mar 11, 2023
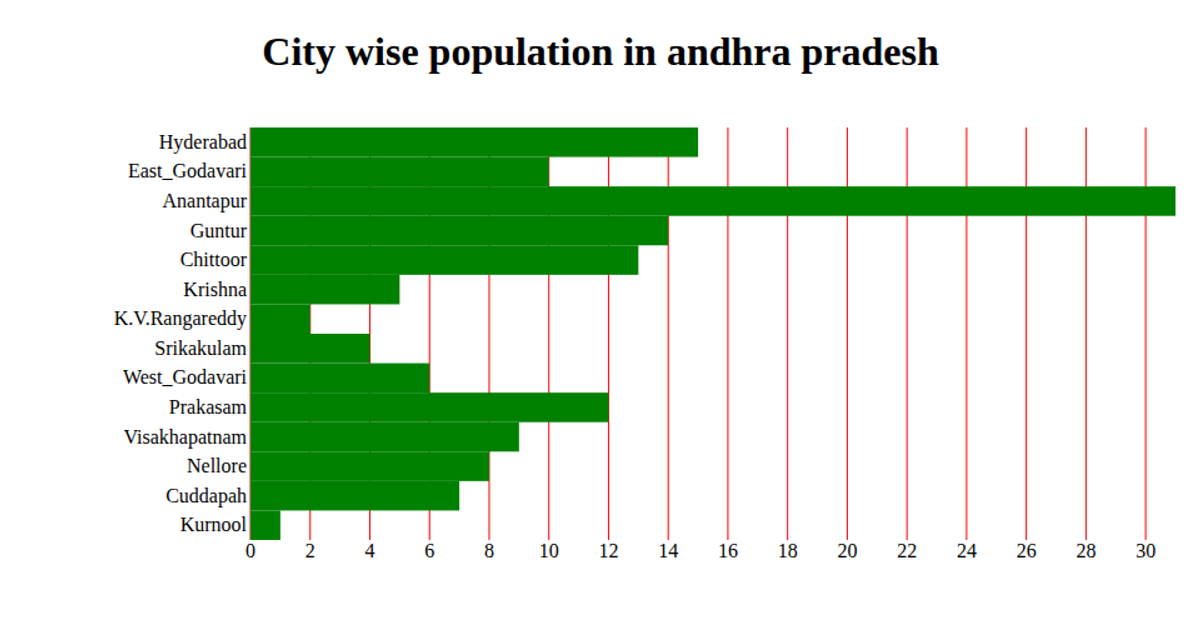
This interactive data visualization displays population and area details for major US cities, rendered as labeled circles on a map using React and D3.js. The chart uses proportional circle sizes to encode population values, with city names placed as text labels. The implementation combines React 16.9 for component structure with D3 5.11 for map projections and geography (d3.geoPath), while the d3.forceSimulation algorithm positions the labels to prevent overlap. Data originates from the ICE-6 dataset, and the visualization runs entirely in the browser with the map drawn on a blank canvas.
AI-generated descriptionA bare minimum HTML page.
MIT Licensed



Comments
Sign in to join the discussion.