🌍 Public
Activity6_Task2_Question
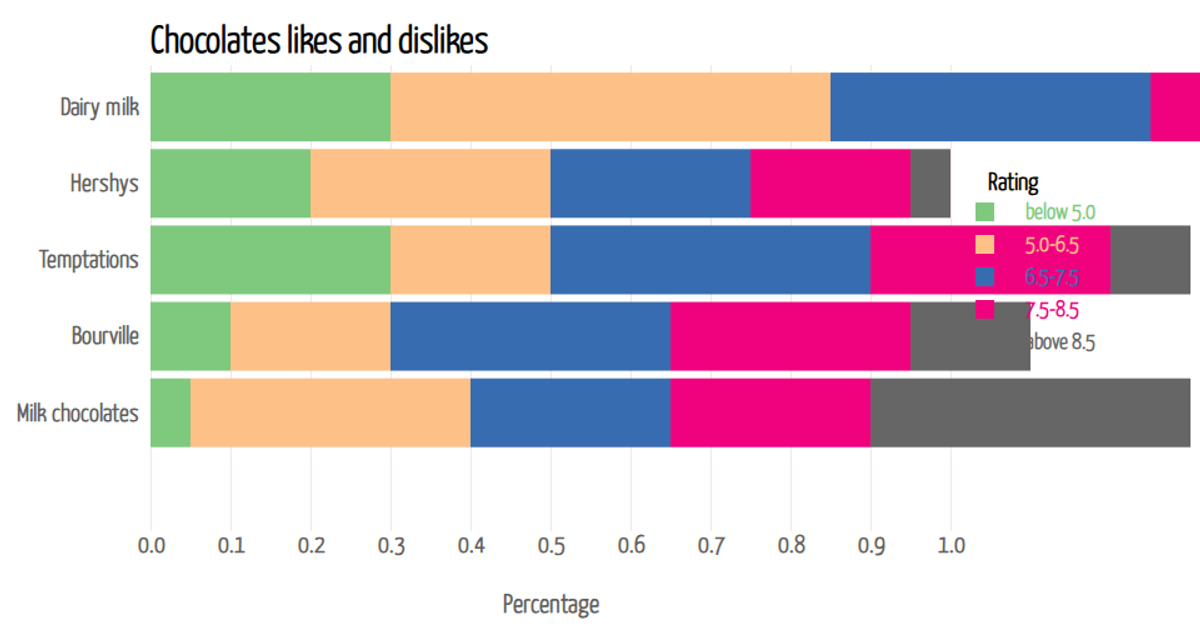
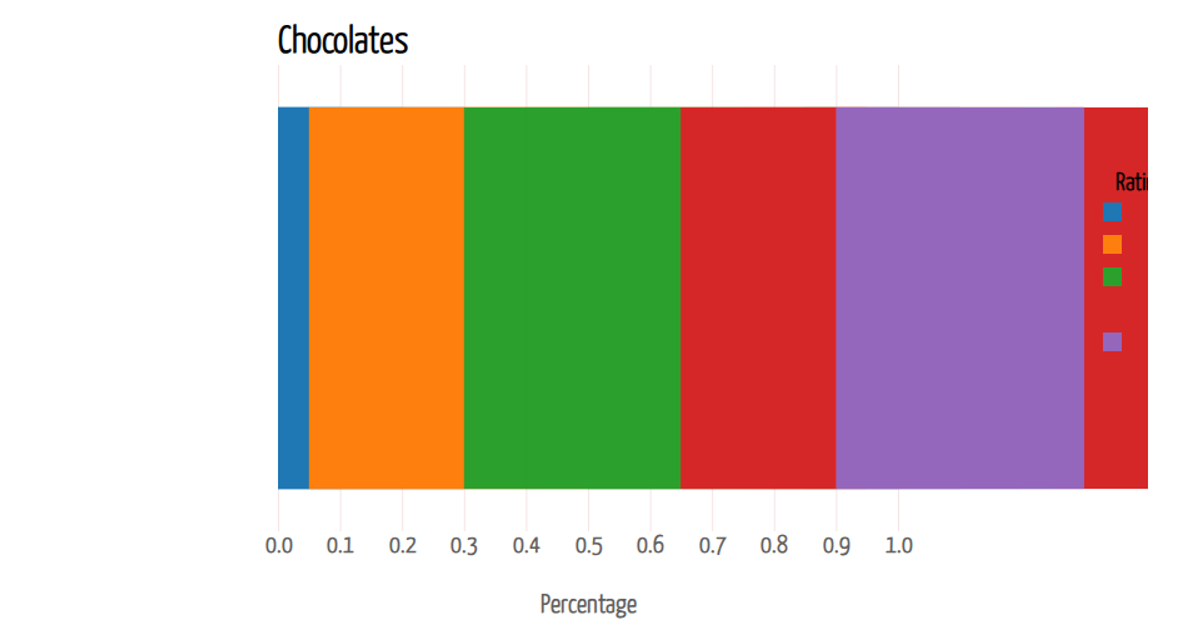
This stacked bar chart visualizes the proportional representation of seven beverages across five serving style categories: hot, cold, carbonated, alcoholic, and non-alcoholic. The chart uses d3.stack() to aggregate data values and d3.scaleBand() for the categorical beverage axis, with d3.scaleLinear() handling the numeric proportion scale. Each bar segment is rendered as an SVG rect, colored via a d3.scaleOrdinal() palette, with a manual legend appended to the right side. The data is embedded directly in the script as a static array of beverage objects.
AI-generated descriptionMIT Licensed




Comments
Sign in to join the discussion.