🌍 Public
Fork of HTML Starter
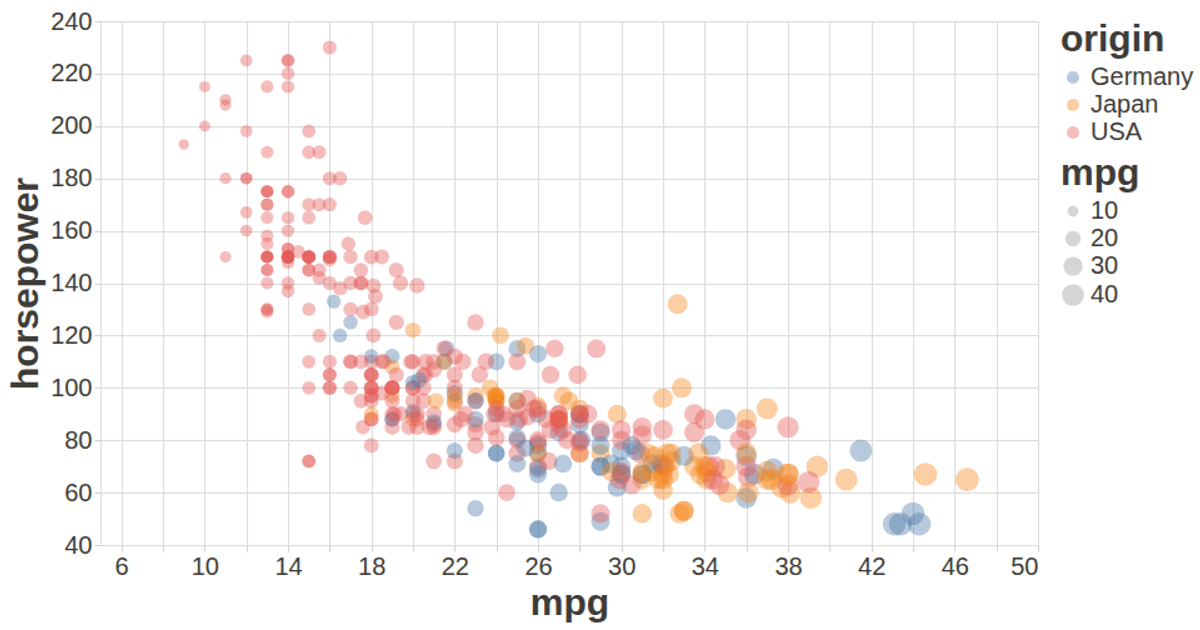
This example displays a scatter plot with three categories on the x-axis and quantitative values on the y-axis, using Vega-Lite’s declarative JSON specification embedded within an HTML page. The page relies on CSS for centered, large-text styling and JavaScript to log a message to the console. The chart itself encodes data points as circles, with category "a" mapped to nominal positions and measure "b" mapped to quantitative coordinates, rendered by Vega-Lite’s default point mark.
AI-generated descriptionA bare minimum HTML page demonstrating use of CSS and JavaScript.
See also React Starter.
MIT Licensed






Comments
Sign in to join the discussion.