🌍 Public
Assign#3
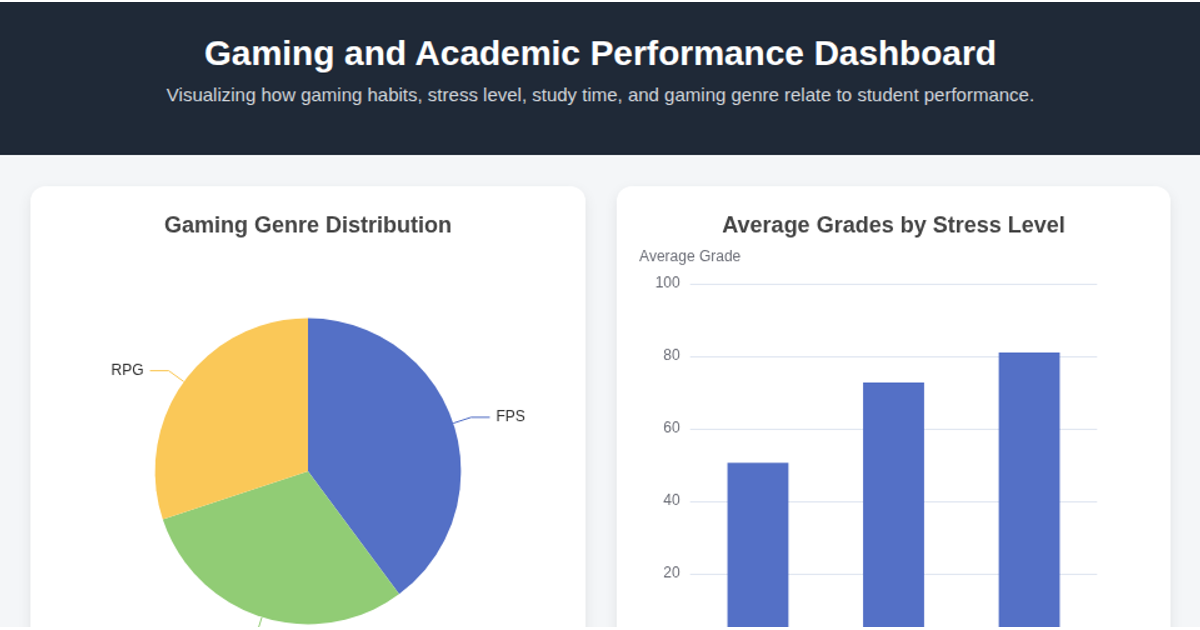
This dashboard visualizes the relationship between gaming habits and academic performance across multiple interconnected charts. It shows genre distribution via a pie chart, average grades by stress level in a bar chart, gaming hours versus grades in a scatter plot, and study hours against grades in a line chart. Built with ECharts 5.3.1, the visualization loads a CSV file using `fetch()` and parses it with a custom `parseCSV` function. Charts are generated through ECharts' API functions `createGenrePieChart`, `createStressBarChart`, `createScatterChart`, and `createStudyLineChart`, with data grouped and averaged using JavaScript's `reduce` and array methods.
MIT Licensed


Comments
Sign in to join the discussion.