🌍 Public
Fork of SharanyaSriram
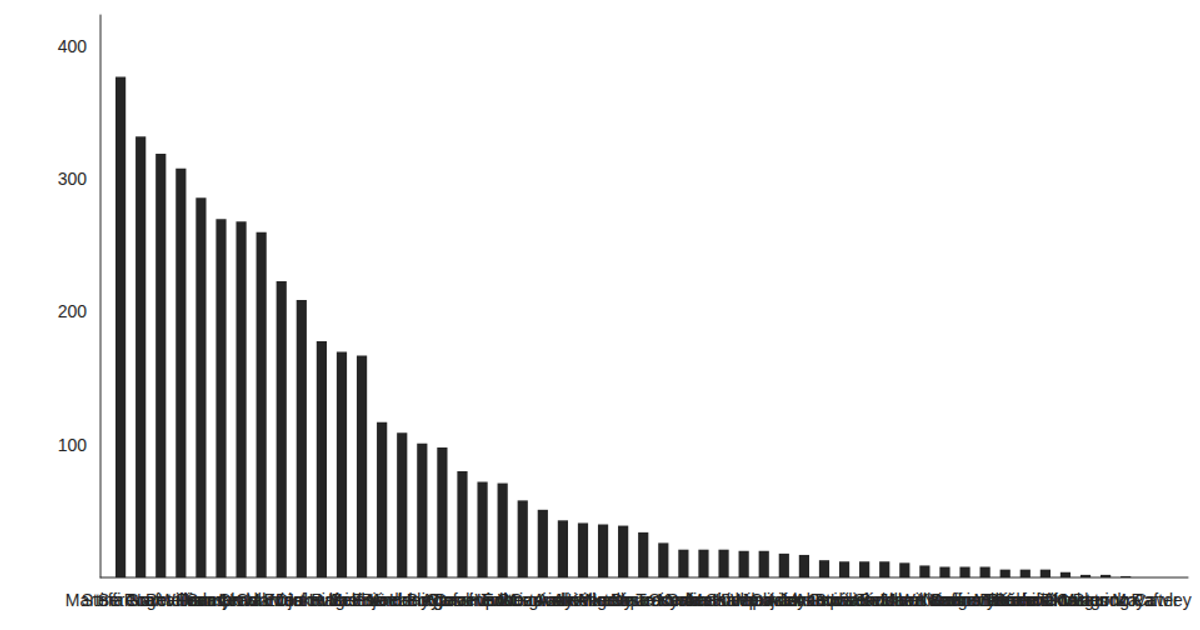
This chart shows the number of weeks each of the top 15 tennis players has played, ranked vertically with horizontal green bars. It uses React for component state and rendering, while D3 v5 handles CSV data loading and scales (`d3.csv`, `scaleBand`, `scaleLinear`). The SVG output includes custom gridlines and axis labels drawn manually via React elements, with a fixed 960×500 viewport. Data originates from a remote CSV file listing player names and weeks.
AI-generated descriptionA bare minimum HTML page.
MIT Licensed



Comments
Sign in to join the discussion.