🌍 Public
High Income countries total GDP data
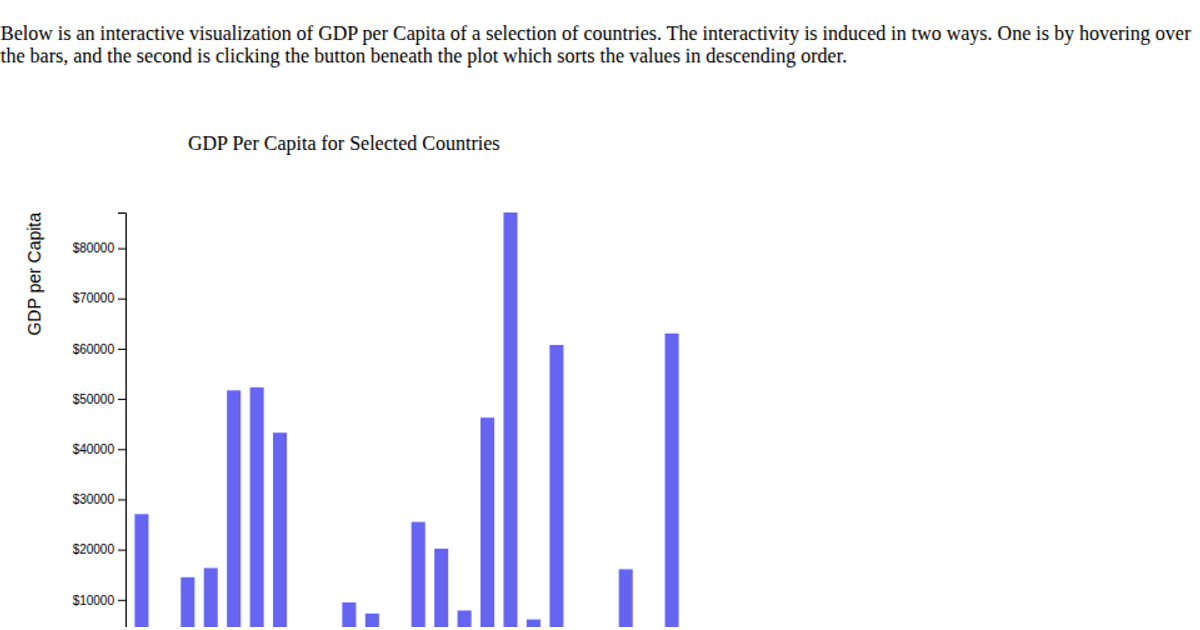
A bar chart displays total GDP for high-income countries across time, with each bar representing a single year and height encoding the GDP value. The visualization uses the vega-lite-api library for chart specification, while d3.csv loads the dataset from a GitHub gist containing World Bank income-group GDP figures. Tooltips show precise GDP values formatted with SI prefixes when hovering over bars. The chart is styled with customized axis fonts and colors through a vega-lite config object, and rendered as a full-viewport SVG.
AI-generated descriptionA visualization constructed using the vega-lite-api.
MIT Licensed




Comments
Sign in to join the discussion.