🌍 Public
Ep. 34 | Scatter Plot with Color Legend
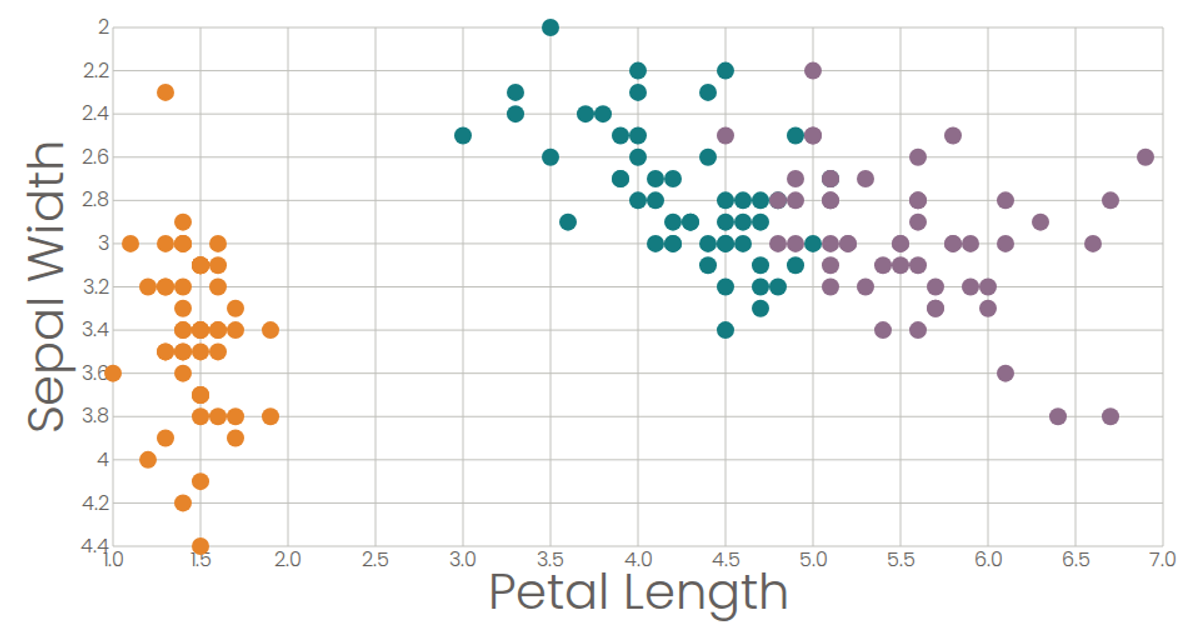
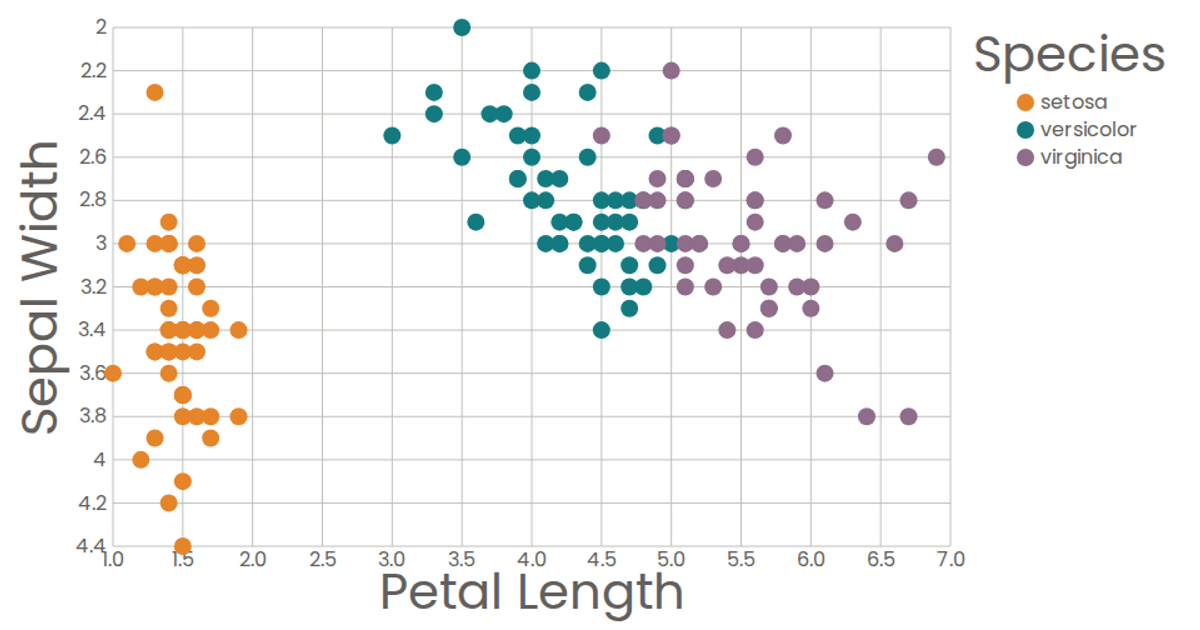
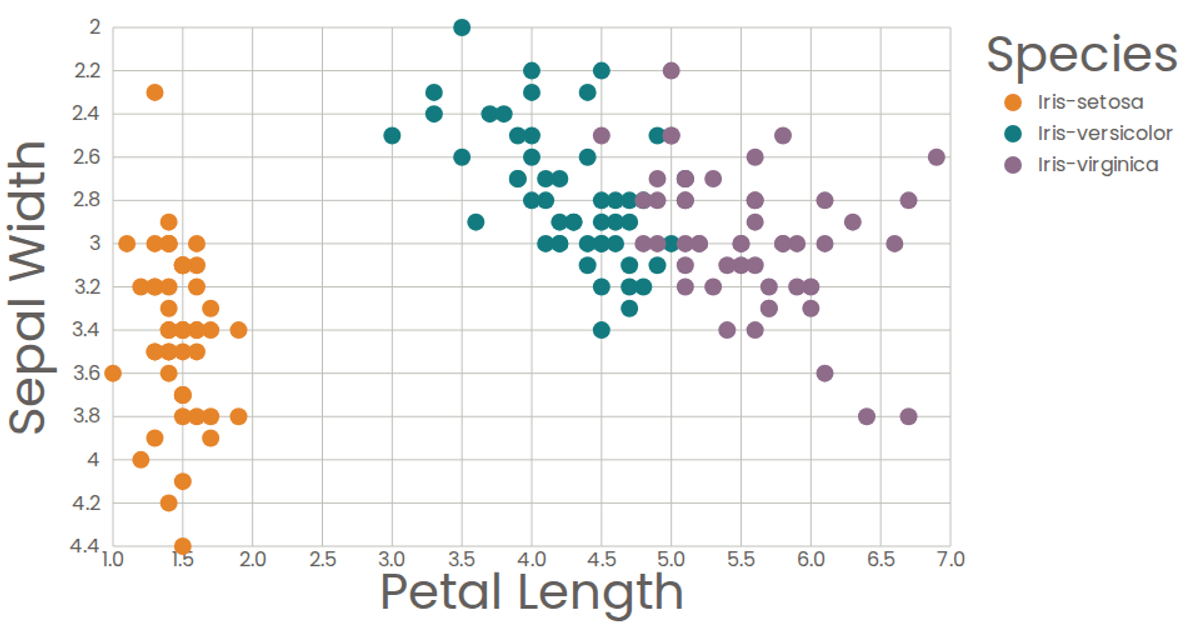
This scatter plot visualizes the classic Iris dataset, plotting petal length against sepal width for three iris species. Each flower is represented by a colored circle, with species differentiated through an ordinal color scale and a dedicated legend. The visualization is built with React and D3 v6, using `scaleLinear` for axes, `scaleOrdinal` for colors, and SVG circles for marks. The data is loaded asynchronously via `csv` from a GitHub gist, with axis components and a color legend created as reusable React components.
AI-generated descriptionA scatter plot of The Iris Dataset.
MIT Licensed



Comments
Sign in to join the discussion.