🌍 Public
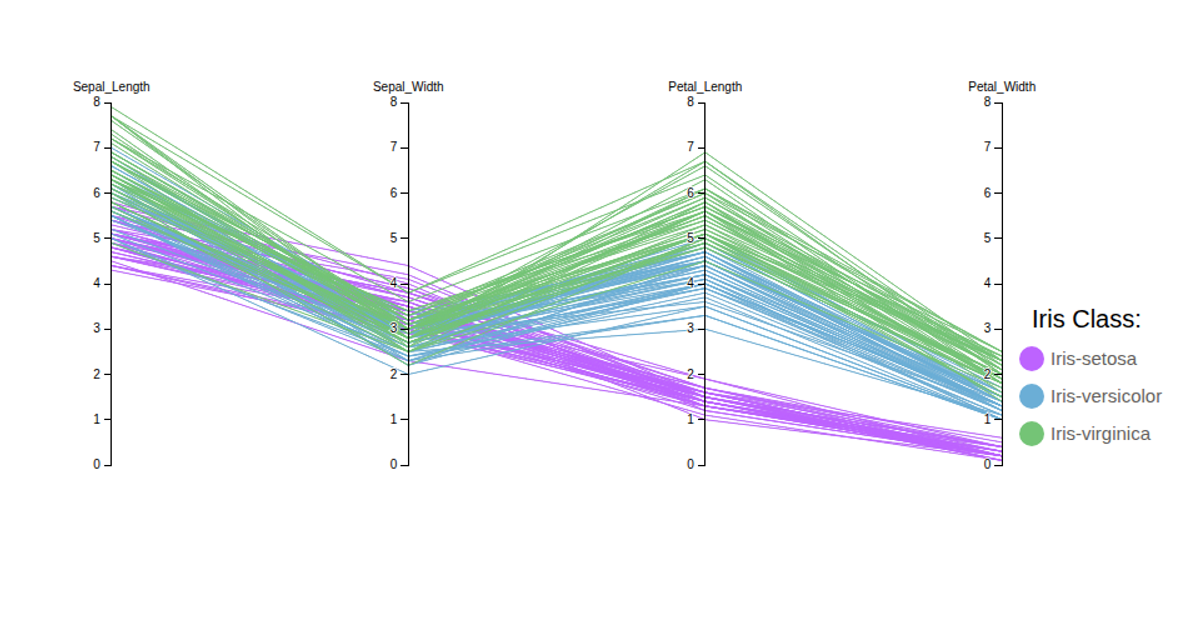
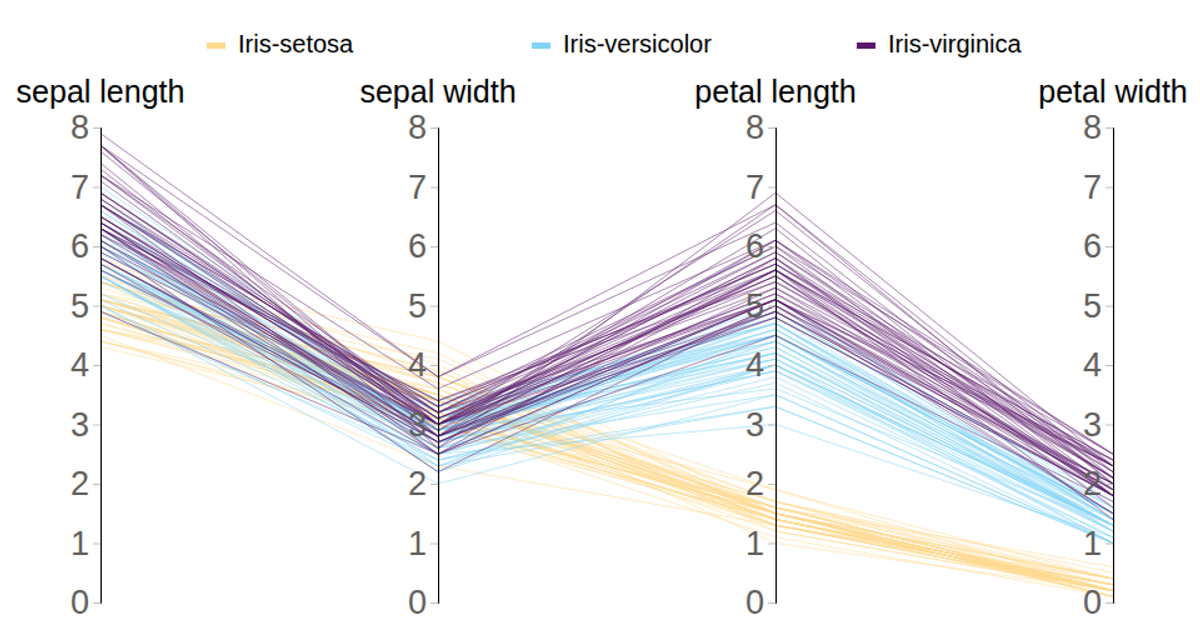
Iris Parallel Coordinate Plots
This visualization uses parallel coordinate plots to display the Iris dataset, with each axis representing a measured attribute and each polyline encoding one specimen’s values. Hovering over a line highlights all specimens of that species while dimming others, using color-coded strokes for the three classes. The implementation relies on D3 v3 APIs such as `d3.scale.ordinal`, `d3.scale.linear`, and `d3.svg.line`, with animated transitions for reordering axes and a brushing extent. Data is loaded via `d3.csv` from a remote source, and the SVG rendering includes interactive mouseover events and a legend.
AI-generated descriptionA bare minimum HTML page demonstrating use of CSS and JavaScript.
See also React Starter.
MIT Licensed




Comments
Sign in to join the discussion.