🌍 Public
practice
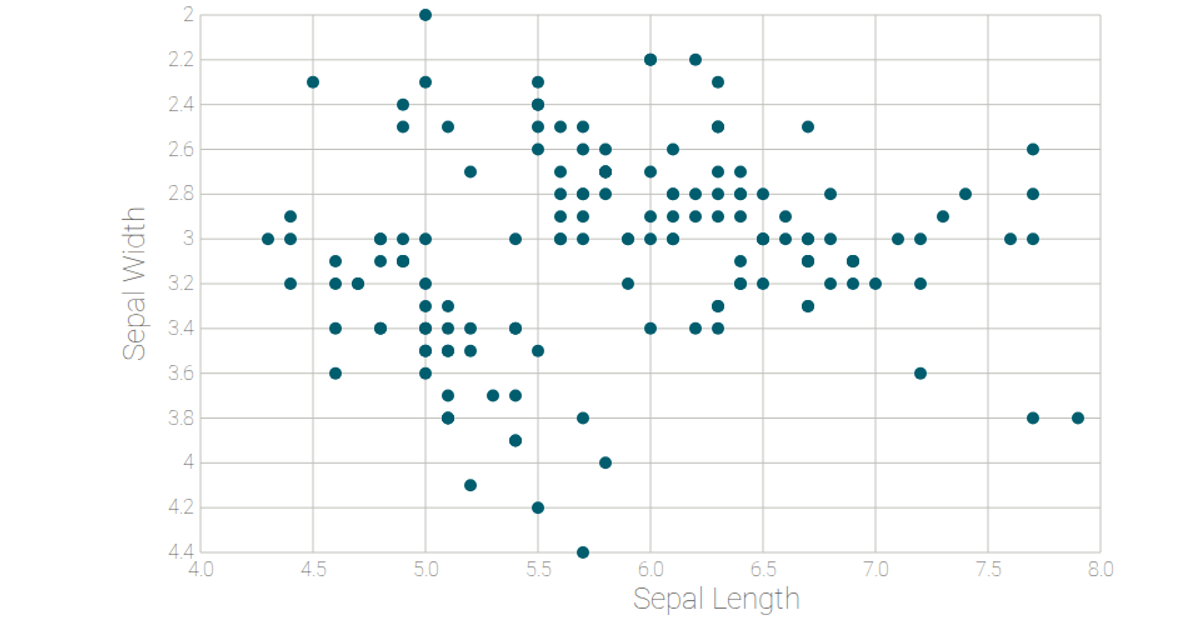
This example shows a scatter plot of the Iris flower dataset, mapping sepal length on the x-axis and petal length on the y-axis, with circles colored by a fixed opacity. The visualization is built using React and D3 v7, where React manages the component lifecycle and the `d3.select` API handles SVG rendering. Data is loaded via `d3.csv` and parsed into numeric fields, while scales are created with `d3.scaleLinear` and axes are appended using `d3.axisLeft` and `d3.axisBottom`. The code demonstrates a decoupled pattern for integrating D3 within a React application.
AI-generated descriptionThis viz is a starter that demonstrates patterns used in real world projects in which complexity is anticipated to scale.
- Decoupled React & D3 integration
- Opening moves for scalable complexity
- Industry standard ES modules and JSX
- Copy-paste into existing projects
Any questions? Ask on Twitter!
Also viewable in:
MIT Licensed



Comments
Sign in to join the discussion.