🌍 Public
CO2-buttons
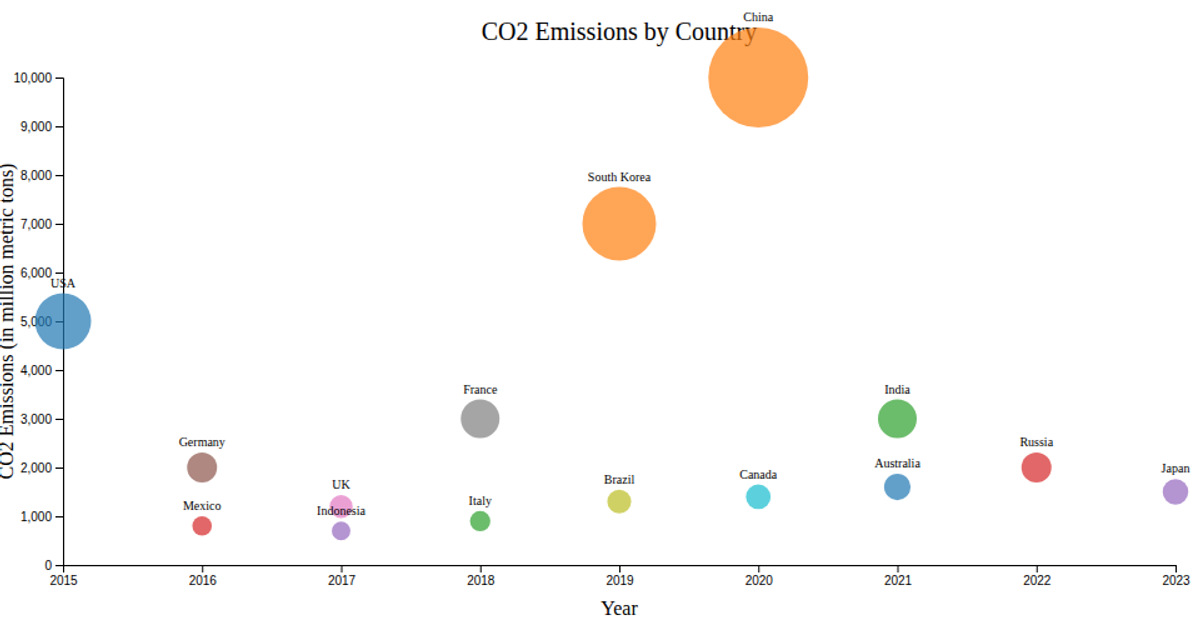
This interactive line chart tracks CO2 emissions per capita from 2000 to 2008 for Germany, France, and the United States. A dropdown menu lets users switch between countries, triggering a smooth transition that updates both the line and its accompanying dots. The visualization loads data from a CSV file using d3.csv and renders an SVG with D3 v4, relying on d3.line for the path, scaleLinear for axes, and .transition().duration(1000) to animate the changes.
AI-generated descriptionAn example showing the capabilities of VizHub.
MIT Licensed




Comments
Sign in to join the discussion.