🌍 Public
Fork of ICE-6
Aayodhyanandh
Last edited Mar 10, 2023
Created on Mar 10, 2023
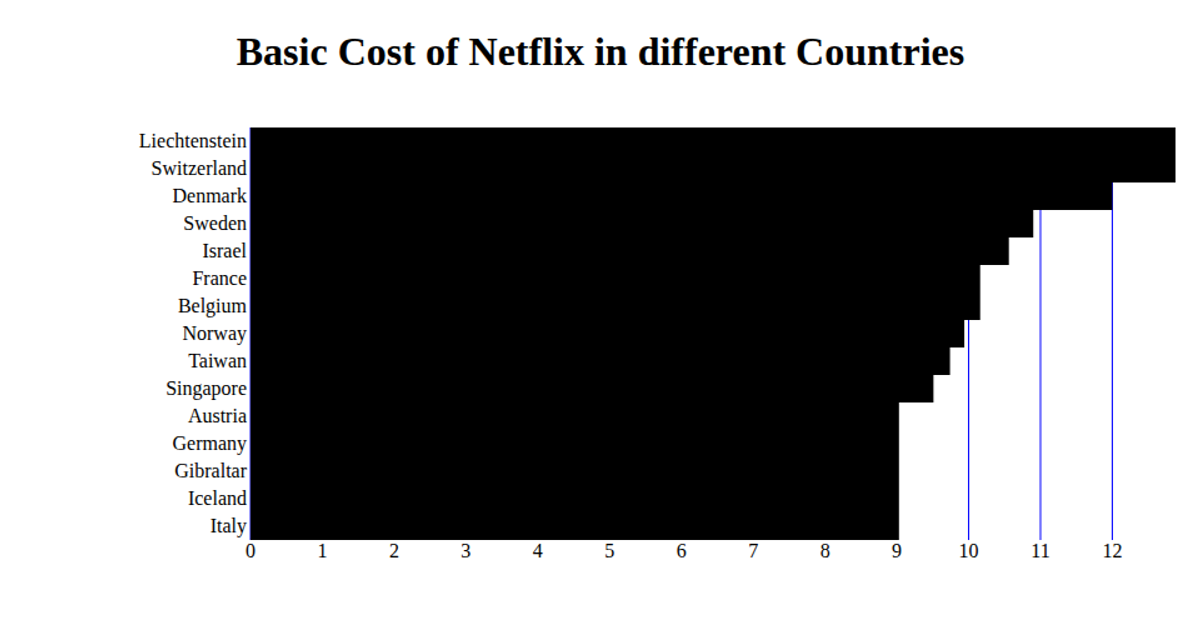
A fork of the ICE-6 example displays the basic monthly cost of Netflix in various countries using a horizontal bar chart. The visualization is built with React and D3 v5, rendering SVG bars whose lengths correspond to the `basic_cost` field from a CSV dataset of Indian players, though the title suggests cost data. The code constructs scales with `d3.scaleBand` and `d3.scaleLinear`, draws axes and gridlines manually, and loads data via `d3.csv`. The chart shows the top 15 countries, with bars and tick labels positioned using scale mappings.
AI-generated descriptionA bare minimum HTML page.
MIT Licensed




Comments
Sign in to join the discussion.