🌍 Public
Question2
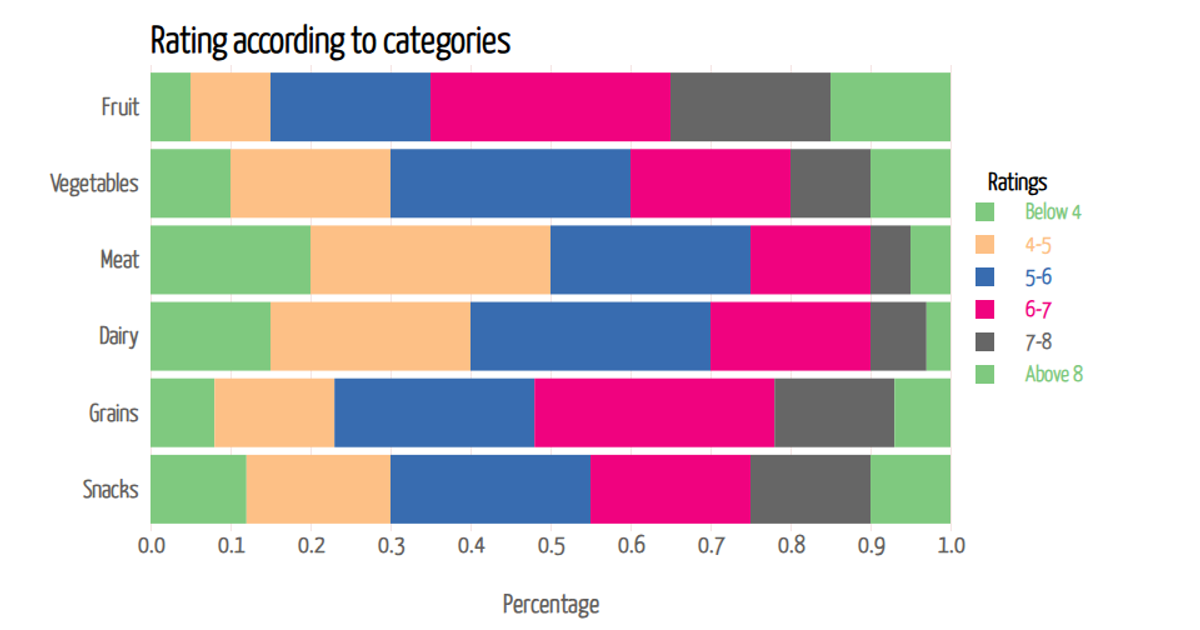
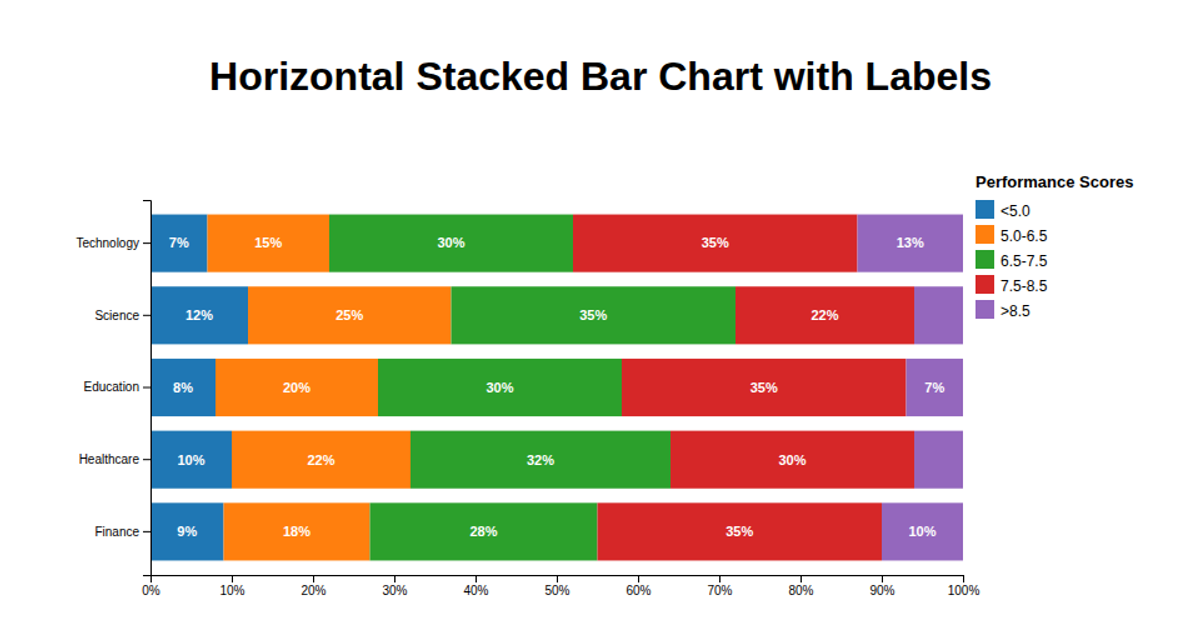
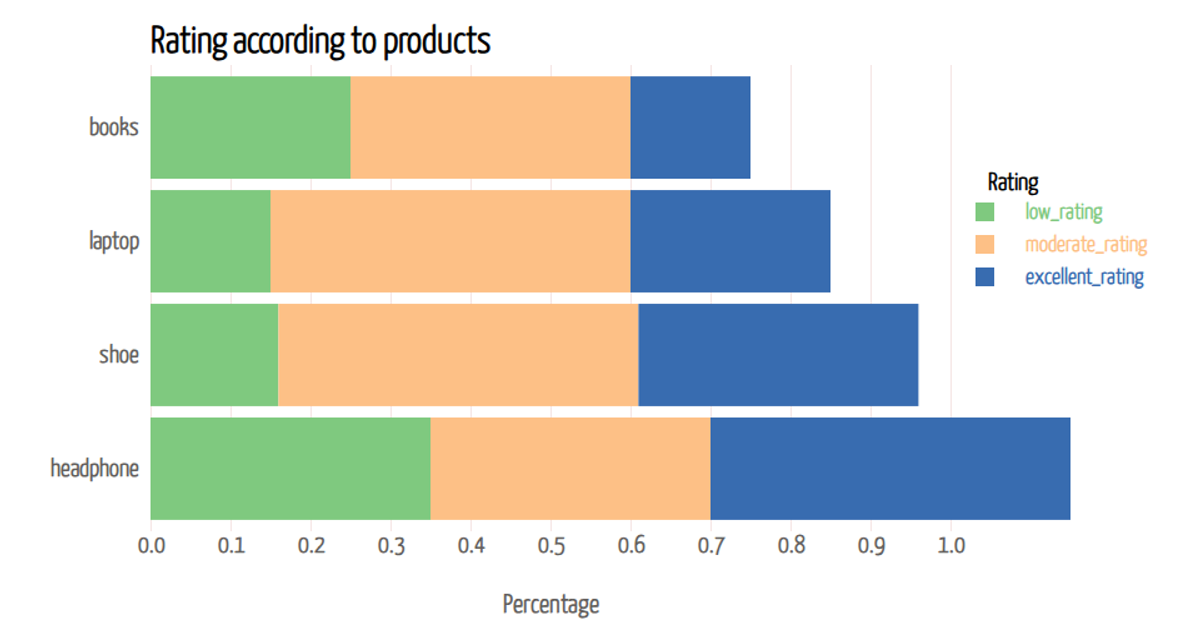
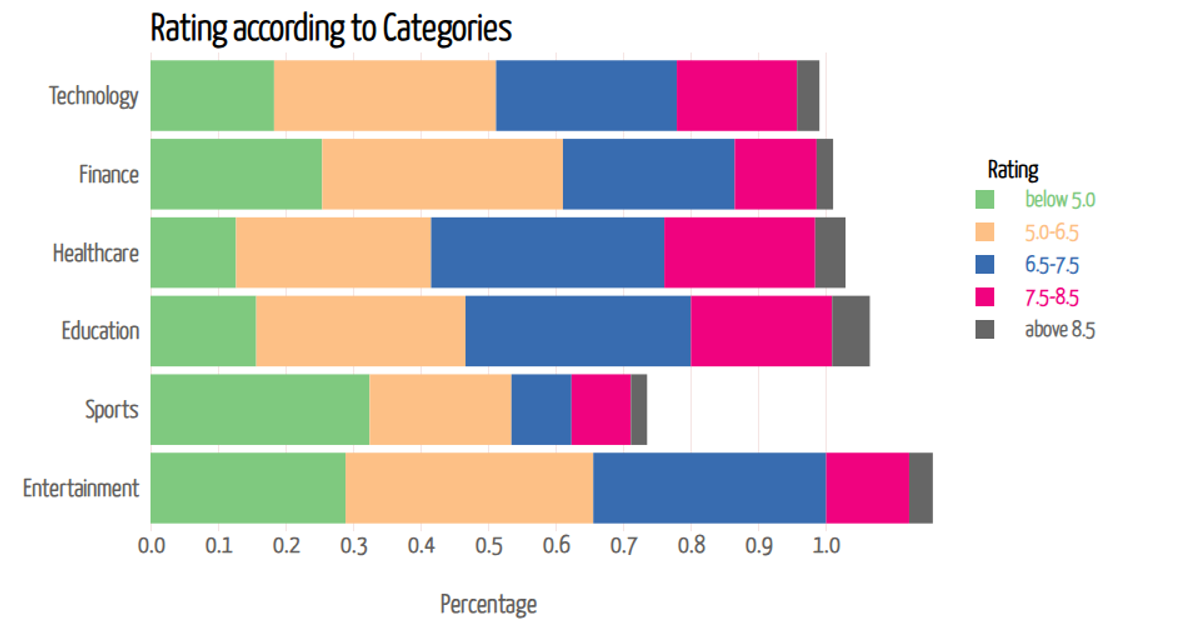
This stacked bar chart visualizes the distribution of customer ratings across five service categories, with each bar segmented into proportions from "poor" to "excellent." The chart uses a horizontal layout with a linear x-axis for percentages and a categorical y-axis for services. It is built with D3 v7, leveraging `d3.stack`, `d3.scaleLinear`, `d3.scaleBand`, `d3.scaleOrdinal`, and `d3.axisBottom` to render the SVG. Hovering over any segment reveals a tooltip displaying the exact percentage for that rating category.
AI-generated descriptionMIT Licensed



Comments
Sign in to join the discussion.