🌍 Public
One Slider Affecting Two Charts
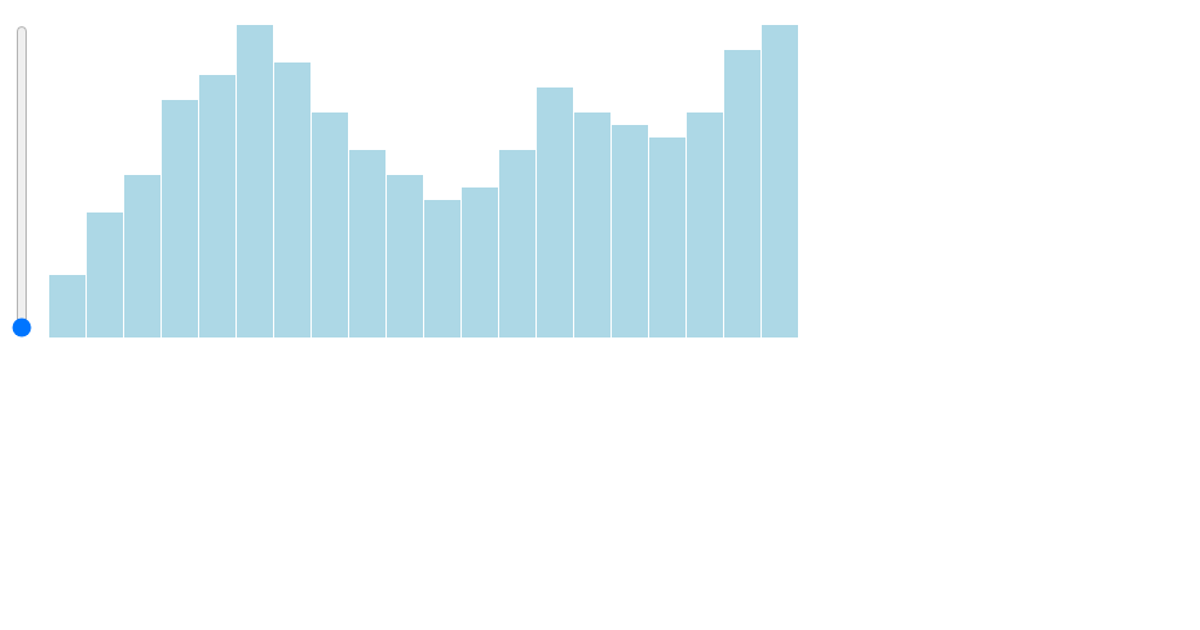
This example shows two identical bar charts displaying capital gains by sector, with a slider that selects a date to update both charts simultaneously. The code uses D3 v7 to parse CSV data, nest it by date, and render SVG bar charts with axes. A range input controls the selected date, triggering the `updateCharts` function to rebuild both charts with new data. The visualization demonstrates how a single UI control can synchronize multiple views of a dataset.
AI-generated descriptionA bare minimum HTML page demonstrating use of CSS and JavaScript.
See also React Starter.
Coded with help from ChatGPT 3.5
MIT Licensed



Comments
Sign in to join the discussion.