🌍 Public
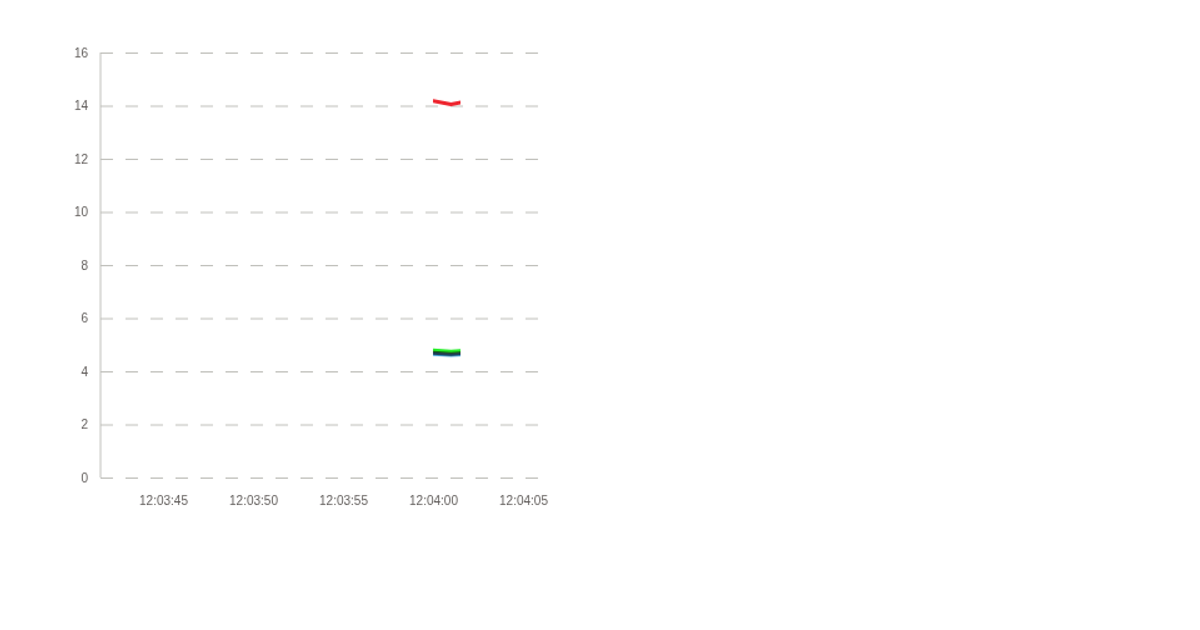
Time based moving graph
This animated chart tracks four network metrics (Partner, PCL, GOLAN, DriveU) over a two-minute period. It shows a moving time window, with the axis and legend translating leftward to follow the data. The visualization uses D3 v6 'scaleTime' and 'scaleLinear' for axes, 'line' for paths, and 'transition' with 'easeLinear' for animation. Data is sourced from a CSV file containing per-second readings.
AI-generated descriptionMIT Licensed




Comments
Sign in to join the discussion.