🌍 Public
D3 Starter
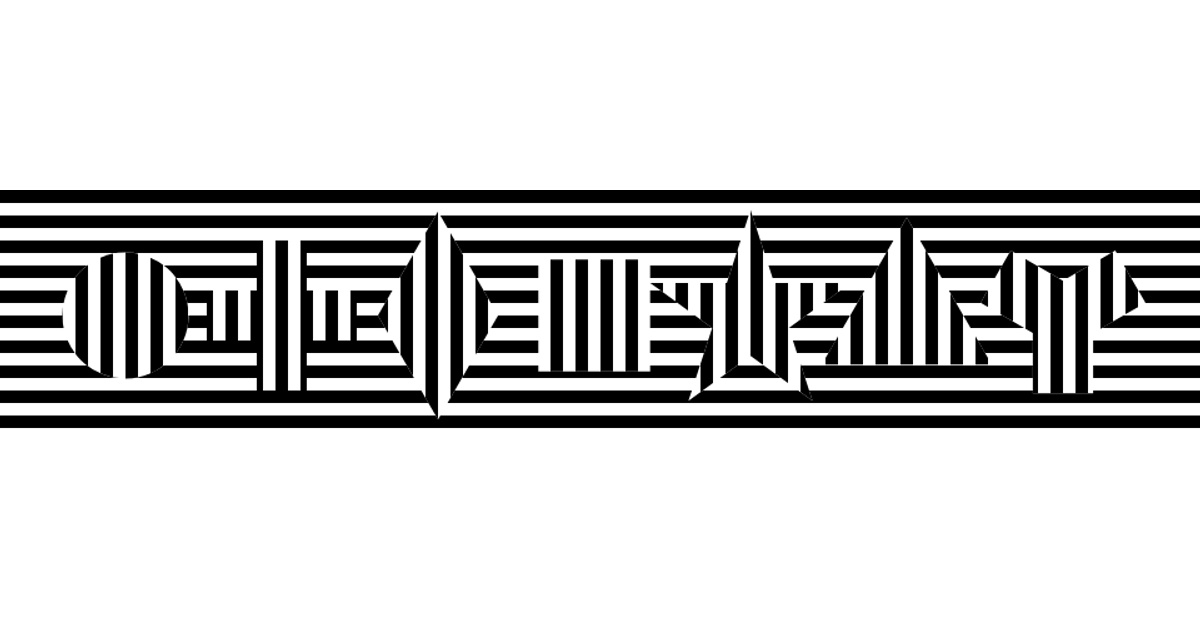
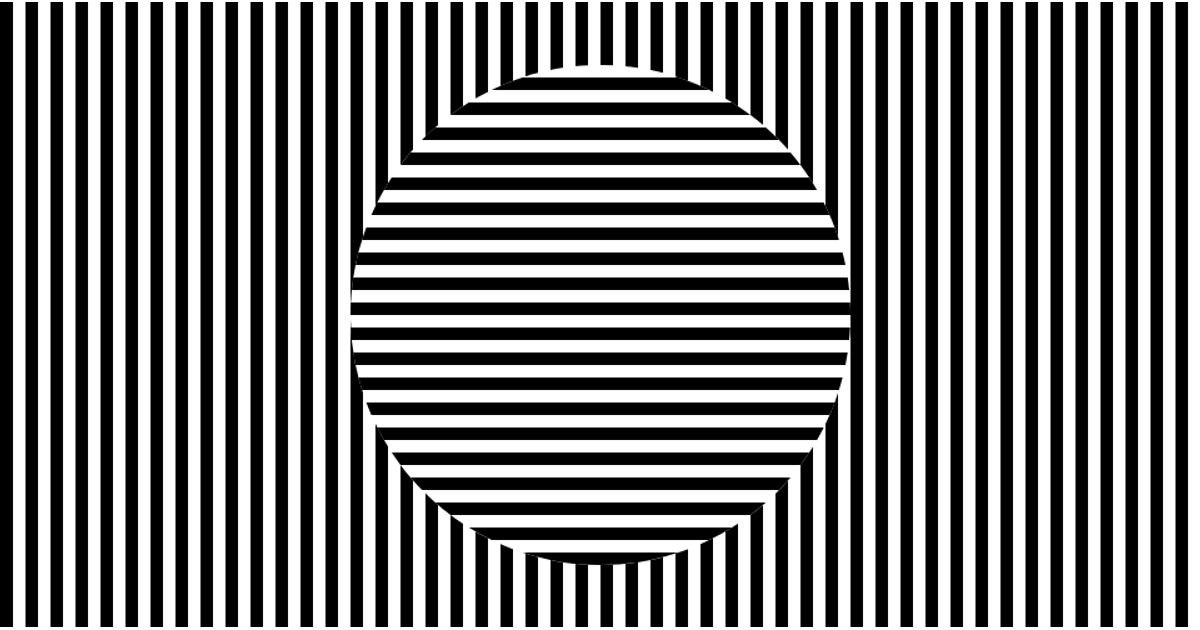
This example demonstrates a generative, grid-based visual composition using D3 version 7. It creates an SVG canvas that fills the browser window and draws 100 horizontal and vertical striped rectangles, each masked by a set of overlaid symbols. The code uses D3's `select`, `range`, `symbols`, and `symbol` APIs to generate the stripes and to render mask patterns that reveal or hide the underlying grid. The masks are created with SVG `<mask>` elements, and the two complementary masks produce an interlaced effect across the screen.
AI-generated descriptionA demonstration of how to start using D3 version 6.
MIT Licensed




Comments
Sign in to join the discussion.