🌍 Public
Visitors/Date
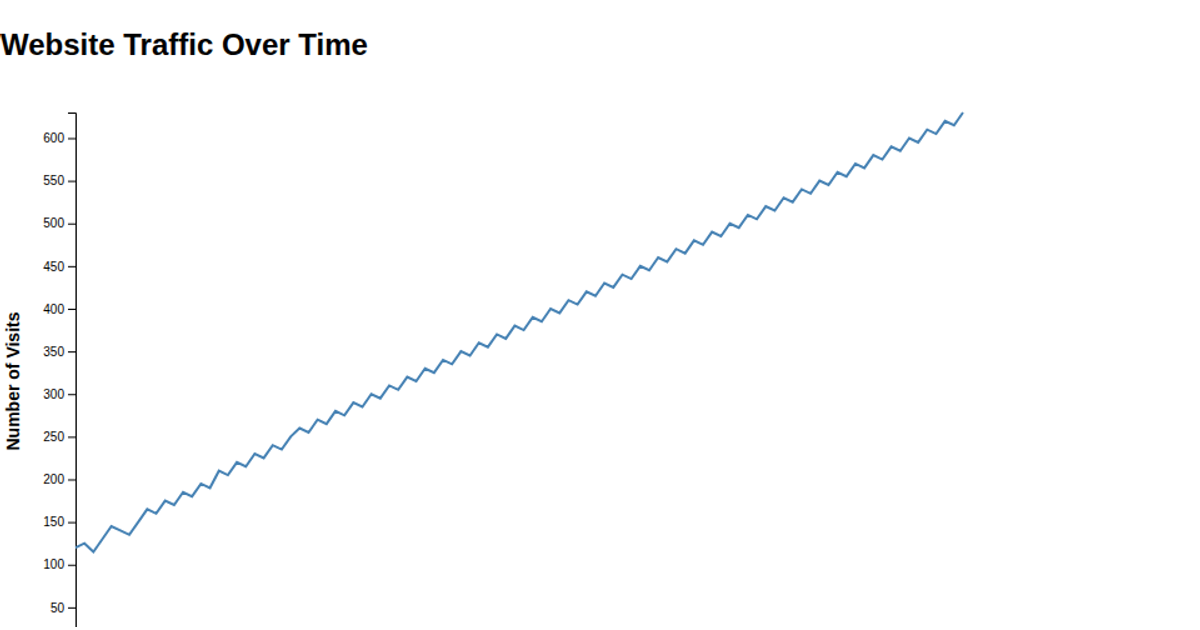
This example shows a line chart of daily visitor counts from a CSV file, with dates on the x-axis and visitor numbers on the y-axis. The code loads the data using the `d3.csv` API from D3 v5, then logs the parsed data to the console. The visualization itself is not yet rendered; the script currently only retrieves and prints the data, leaving the drawing of the chart to a subsequent step. The chart will eventually use D3's scales and SVG path functions to map the date and visitor values to visual elements.
AI-generated descriptionMIT Licensed



Comments
Sign in to join the discussion.