🌍 Public
Fork of Fork of line chart section 3
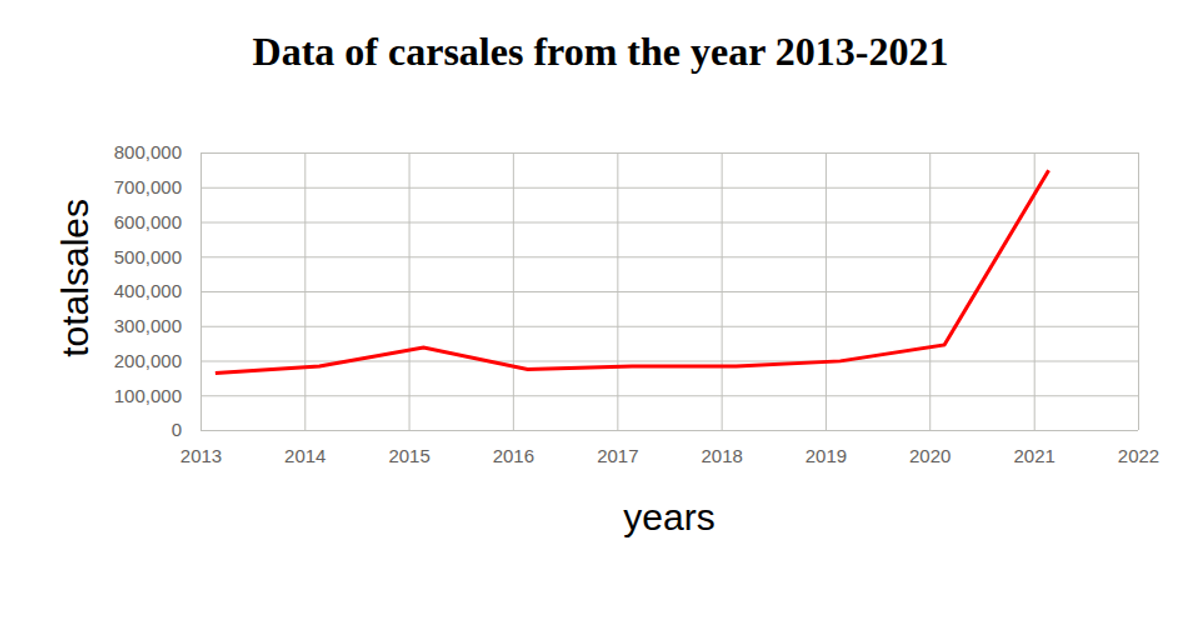
This example visualizes car sales data from 2013–2021, plotting total sales against years. The chart uses a red line to show the trend over time, with axes labeled "years" and "totalsales." It loads data from a CSV file, parses dates with `d3.timeParse`, and renders as an SVG using D3 v5 functions like `scaleTime`, `scaleLinear`, `axisBottom`, `axisLeft`, and `line`. Gridlines are styled with tick sizes, and axis labels are added via appended text elements.
AI-generated descriptionMIT Licensed



Comments
Sign in to join the discussion.