🌍 Public
My d3 skill
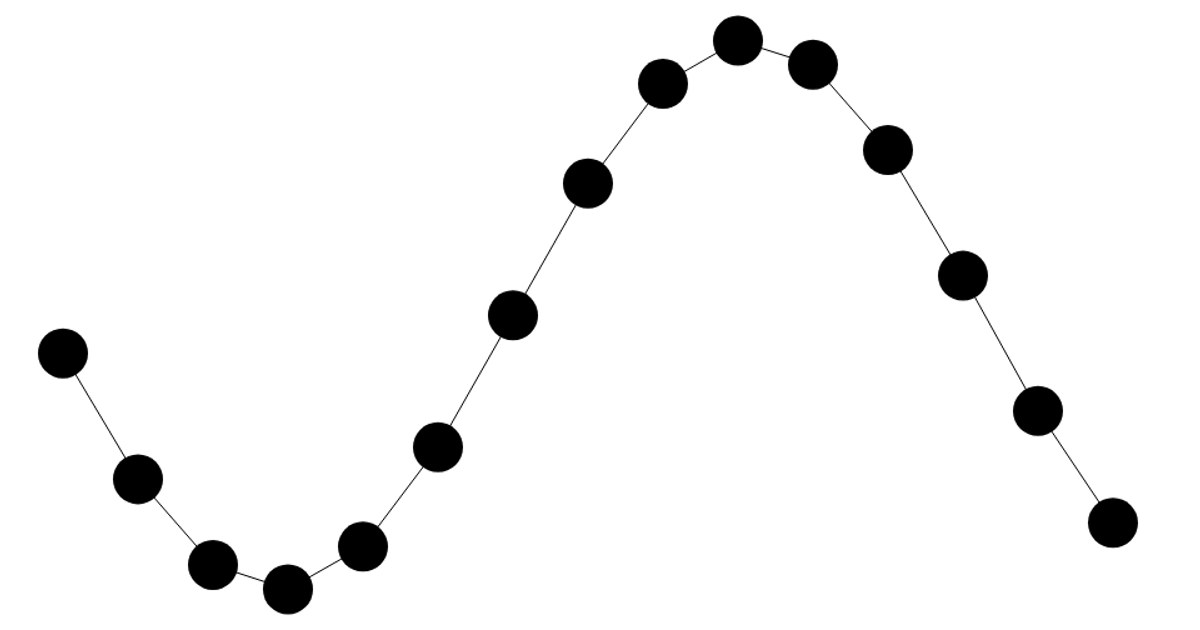
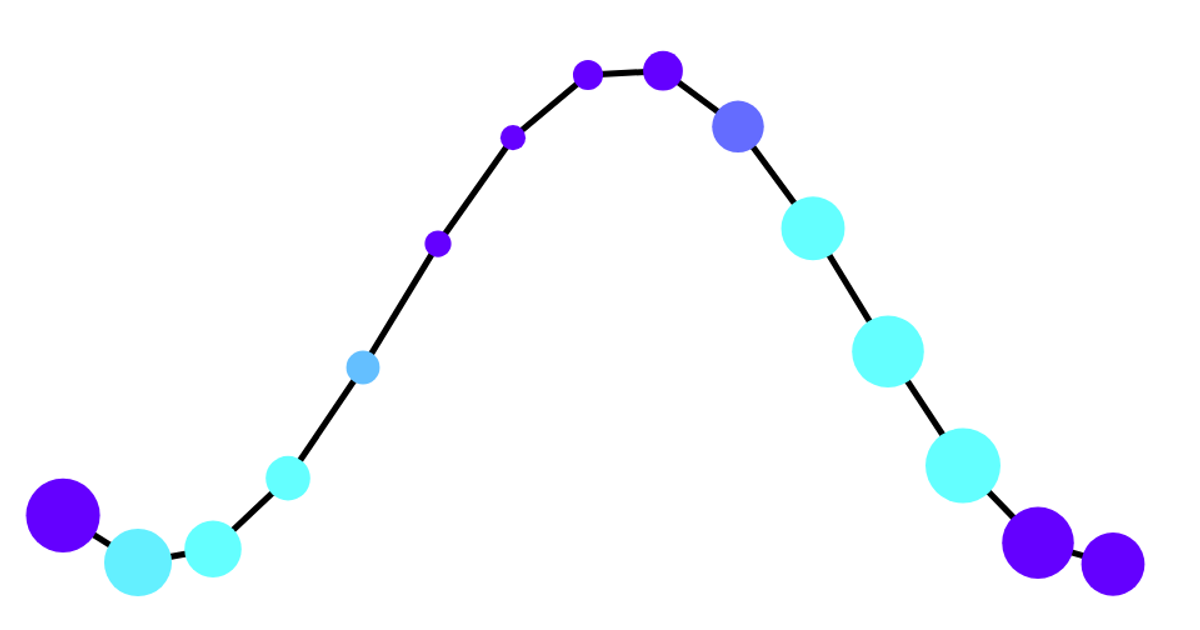
This example animates a sinusoidal line chart generated from a sequence of one thousand data points, rendering the path with SVG and a smooth transition. The visualization uses d3.line to compute the curve, d3.scaleLinear and d3.axisBottom for the x-axis, and d3.range to create the initial dataset. Though the code includes a commented-out update to different data, only the initial static render is active, leaving the axis without ticks and the line fixed in place.
AI-generated descriptionMIT Licensed






Comments
Sign in to join the discussion.