🌍 Public
Compare Avg sal by exp
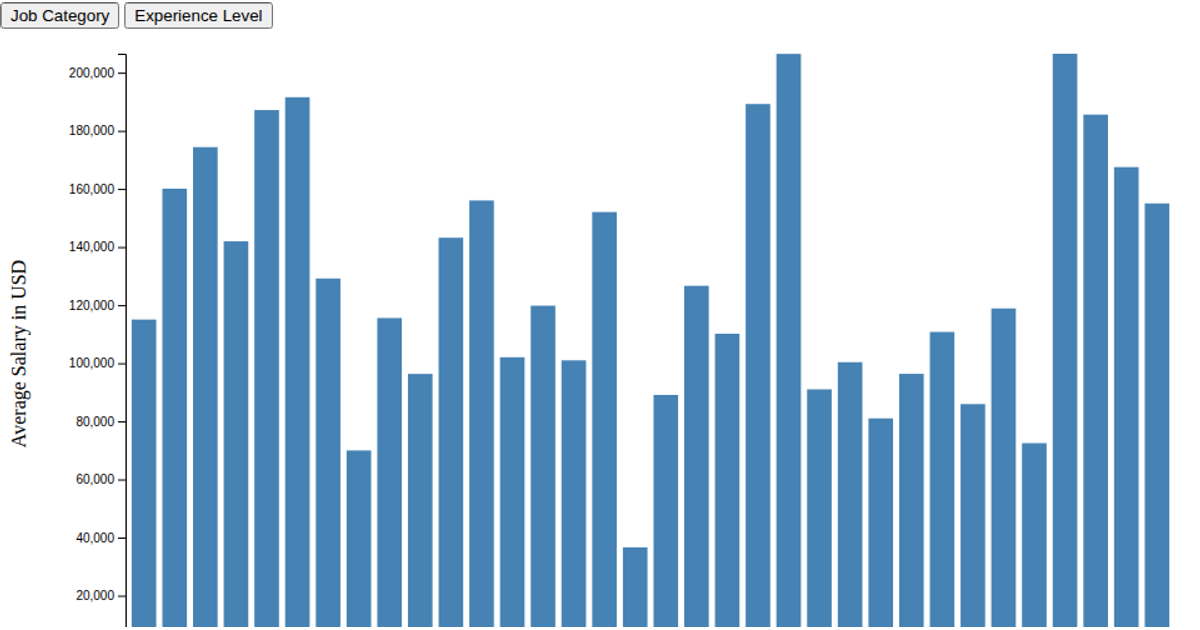
This horizontal bar chart compares average data scientist salaries across different experience and employment type combinations. The visualization groups salary data by experience level and employment type, calculating mean salaries in USD. Bars are color-coded by employment type using a categorical color scheme, with a legend displayed on the right. The D3 v6 code uses `d3.group`, `d3.mean`, `d3.scaleOrdinal`, and `d3.scaleBand` to process and render the data from a CSV source, with SVG output. Both axes and legend are generated using D3's axis and legend APIs.
AI-generated descriptionMIT Licensed


Comments
Sign in to join the discussion.