🌍 Public
Click to Select
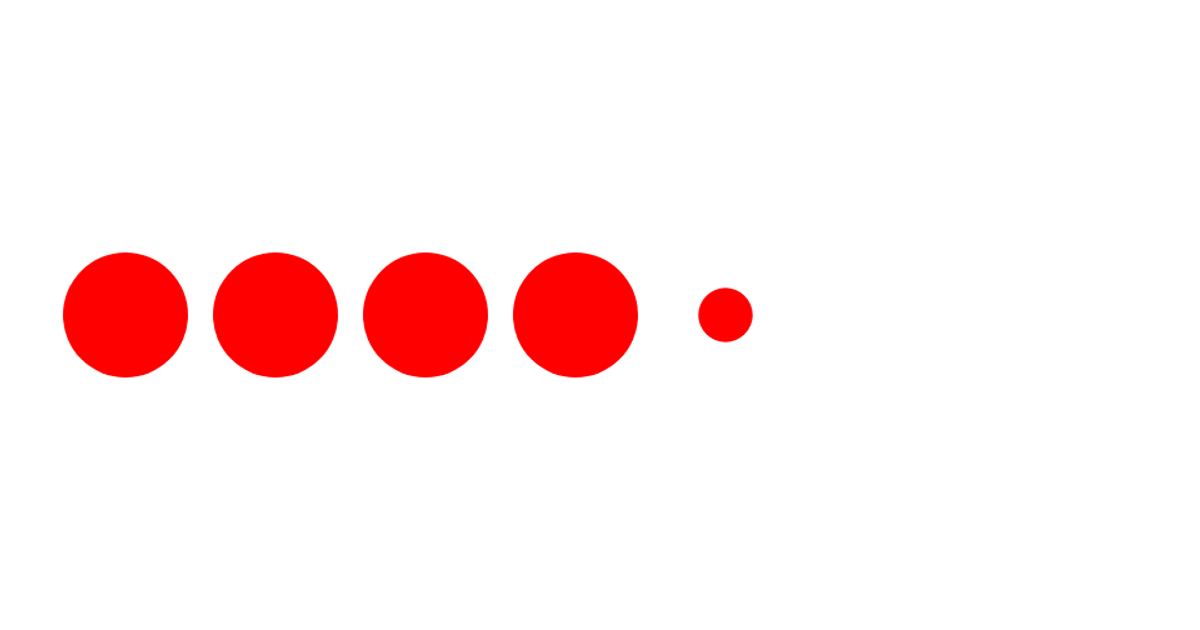
Five fruit shapes appear in a row, rendered as SVG circles with labels. Hovering over a circle turns it steel blue, while apples are red and lemons yellow. The visualization demonstrates data joins through animated transitions, removing apples, replacing one with a lemon, and filtering elements at timed intervals. It uses d3-selection, d3-scaleOrdinal, and transition methods to update position, radius, and fill based on a selectedFruit state.
AI-generated descriptionMIT Licensed


Comments
Sign in to join the discussion.