🌍 Public
Activity_6 scatterplot tutorial color 3.1
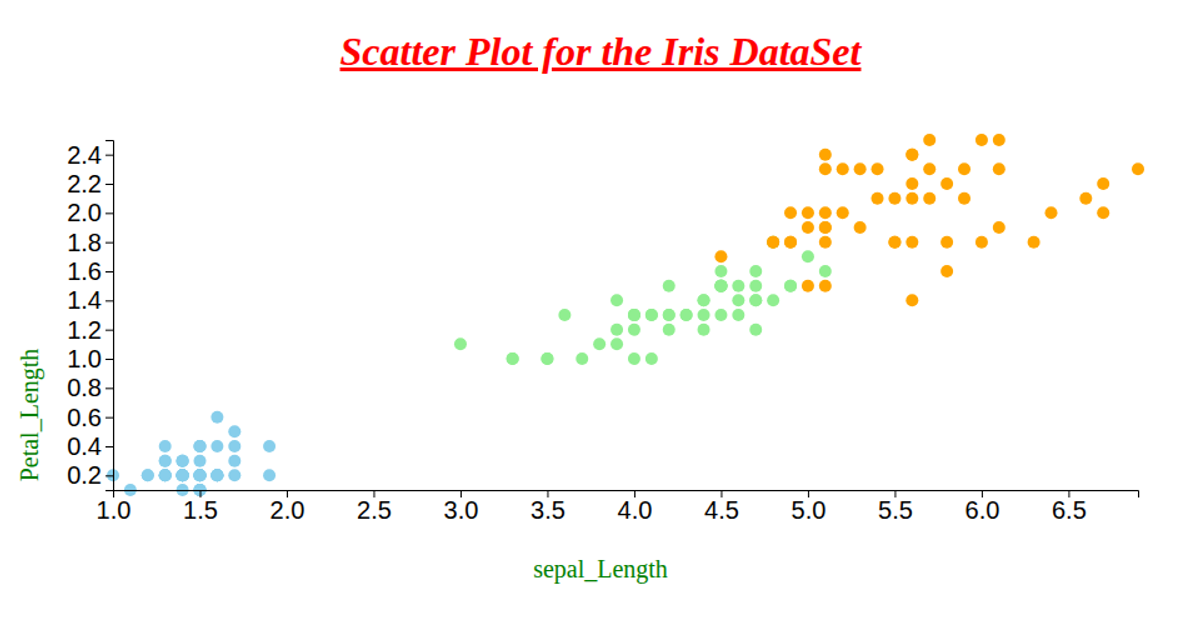
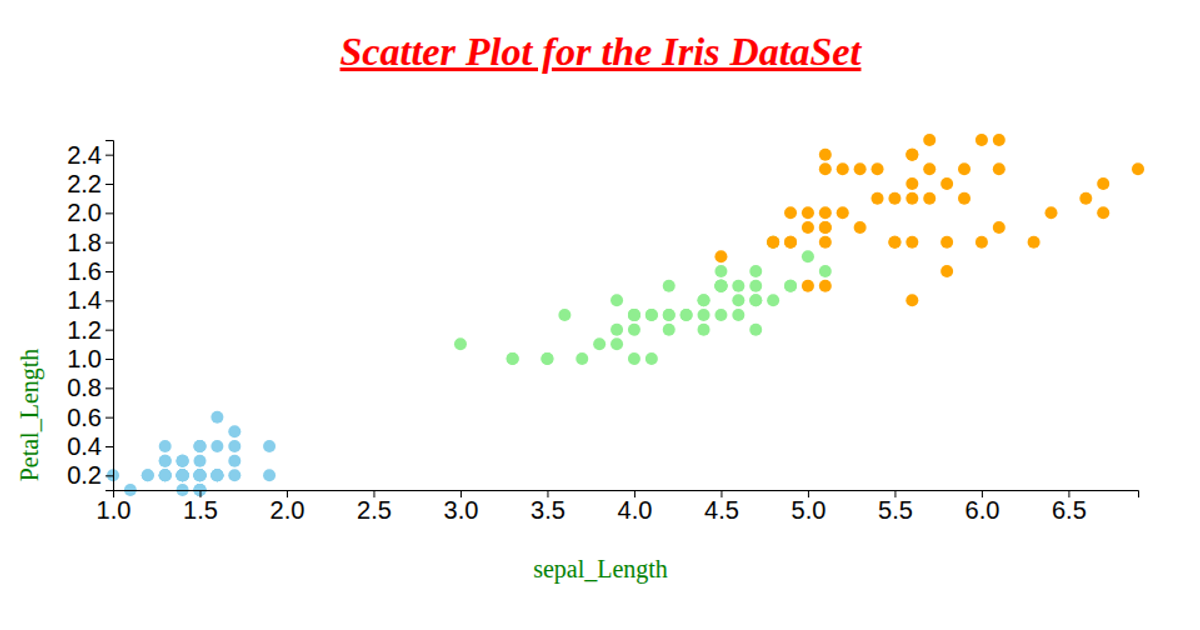
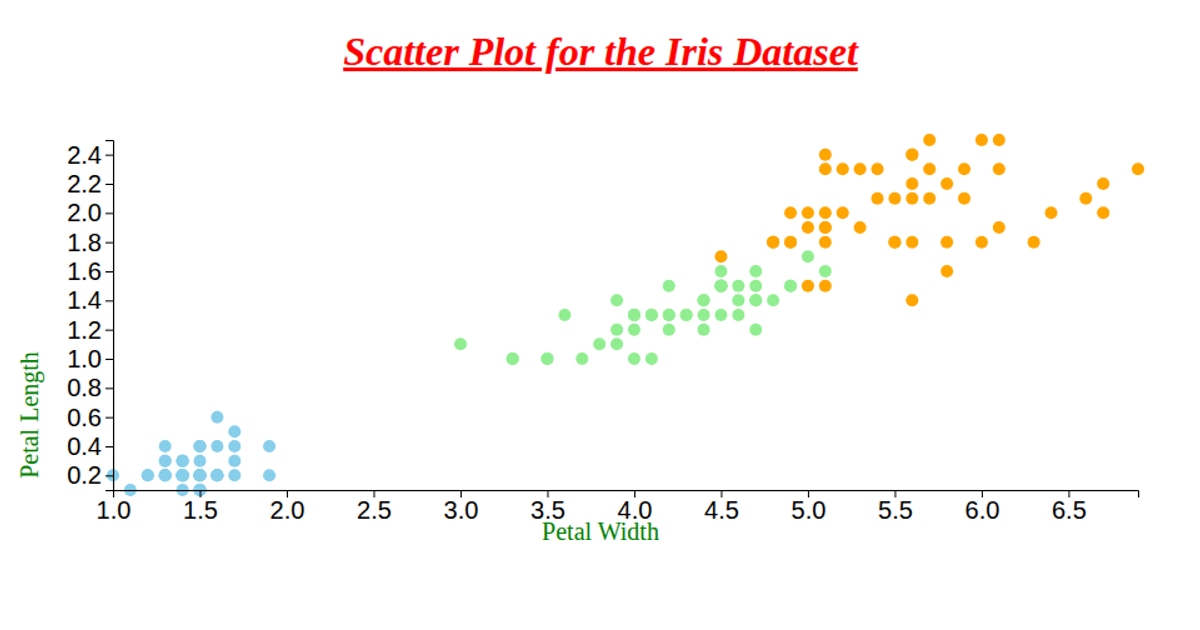
This scatter plot visualizes the Iris dataset, mapping petal length and width for three species of iris flowers. The D3.js v6 code loads the data from a CSV file, scales the axes with `d3.scaleLinear`, and renders circles filled with distinct colors (skyblue, lightgreen, orange) per species. It uses the `d3.extent` and `d3.nice` functions to compute axis domains, and emits SVG axes via `d3.axisLeft` and `d3.axisBottom` with rotated axis labels.
AI-generated descriptionMIT Licensed




Comments
Sign in to join the discussion.