🌍 Public
Fork of Activity_7.2
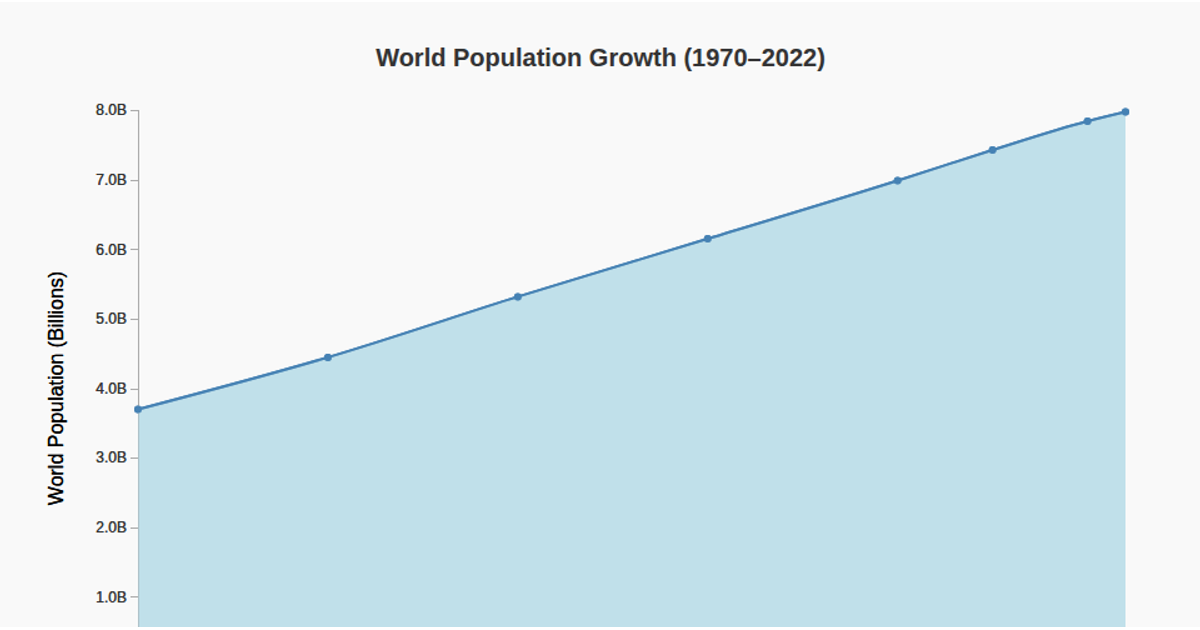
This stacked area chart shows population trends for China, India, the USA, and Indonesia from 1960 to 2020. It uses d3.stack, d3.area, and d3.scaleTime with annotated dots at five-year intervals on a light gray grid. Data is loaded as CSV from a GitHub gist and rendered as SVG with d3-axis for tick marks and a legend. Each country is assigned a distinct fill color with 70% opacity.
AI-generated descriptionA demonstration of Pie chart.
MIT Licensed



Comments
Sign in to join the discussion.