🌍 Public
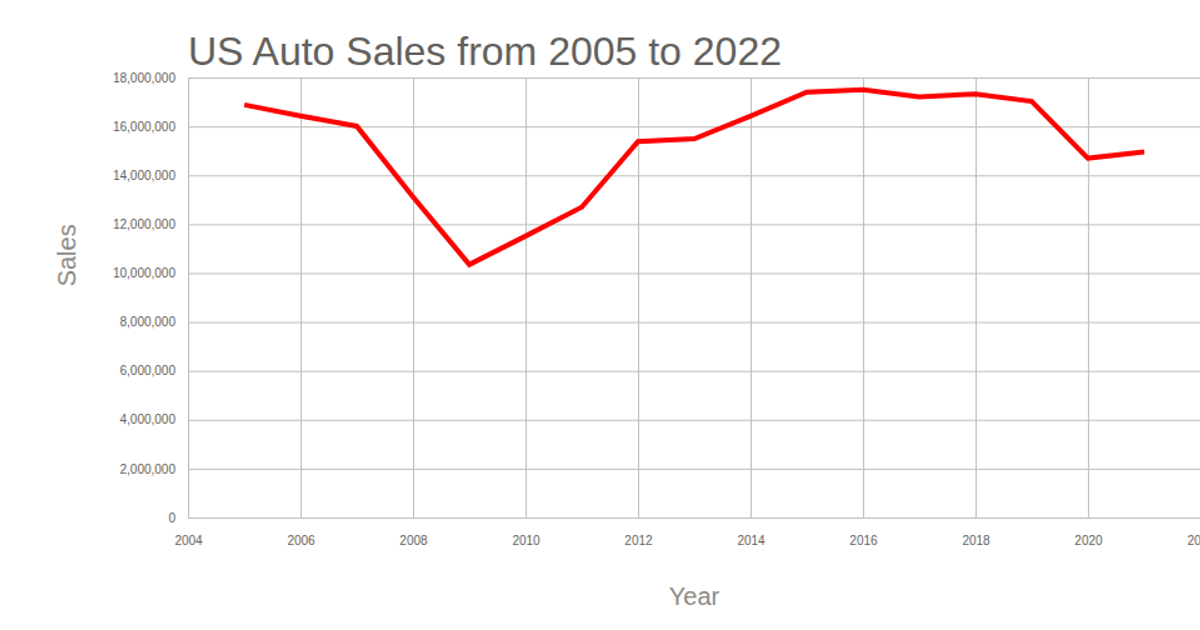
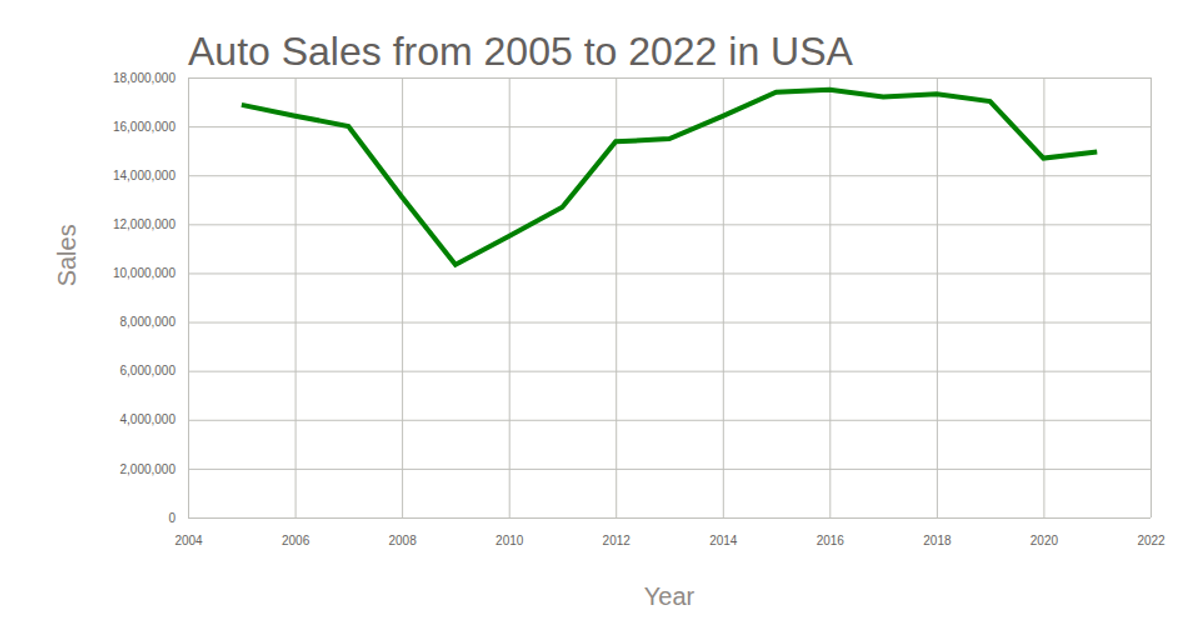
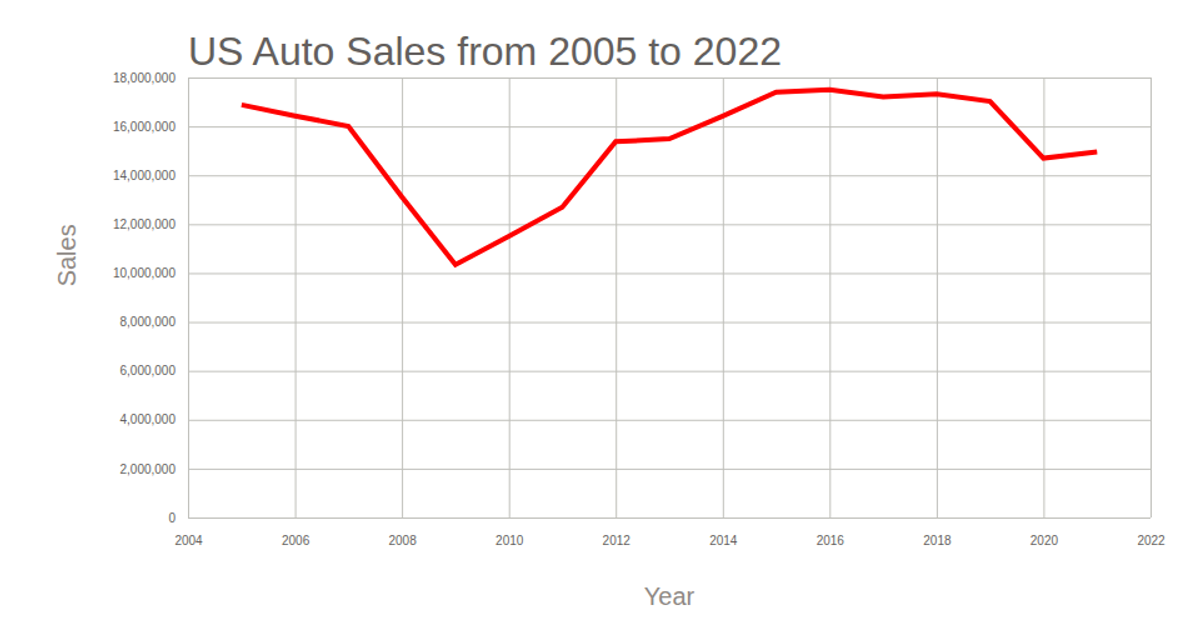
vehicels sale in USA Line Chart
This line chart displays vehicle sales in the USA from 2005 to 2022, with years on the x-axis and sales figures on the y-axis. The visualization uses D3 v5 with an SVG rendering approach, employing `scaleTime` and `scaleLinear` for the axes, and a `line` generator to plot the data. The code loads CSV data from a GitHub gist and formats the year as a date object before drawing. The chart includes axis labels, a title, and an orange line path, with grid lines styled via `tickSize` properties.
AI-generated descriptionMIT Licensed





Comments
Sign in to join the discussion.